CO2 emissions from commercial aviation: 2013, 2018, and 2019
Blog
Polishing my crystal ball: Airline traffic in 2050
The last few years have been tumultuous for the aviation world. Passenger traffic plummeted by two-thirds in 2020 compared to 2019, and recovery has been slower than the industry had hoped. In fact, the International Air Transport Association (IATA) forecasts that 2022 traffic will be just 60% of pre-pandemic levels.
Passenger traffic projections are an important variable in aviation decarbonization roadmaps, as passenger air transport typically accounts for approximately 80% of total commercial aviation carbon dioxide (CO2) emissions. Many groups have released predictions of growth in passenger airline traffic out to 2050. We will look at several of them here, and I’ll make some projections of my own.
Let’s start with the International Civil Aviation Organization (ICAO), which updated its long-term traffic forecast, considering the dampening of travel due to the COVID-19 pandemic. Per annum growth in the number of revenue passenger-kilometers (RPKs) flown is predicted to be 3.6% between 2018 and 2050, down from the 4.2% per year that was projected pre-pandemic. This represents a 4-year lag in travel growth. The 4.2% value now represents the high bound of their projection—a scenario in which economic activity improves faster than expected, and more people fly. If overall economic activity is lower than predicted, passenger traffic growth could be as low as 2.9% per year under the ICAO model.
Another intergovernmental organization, the International Energy Agency (IEA), has derived aviation traffic projections as part of their global average temperature alignment scenarios. Under their Sustainable Development Scenario (SDS), which aligns with a 1.8°C temperature change, global aviation activity grows by 2.9% per year between 2019 and 2050. For their net-zero emissions by 2050 (NZE) scenario, which aligns with a 1.5°C temperature change, traffic growth slows to 1.8% per annum over the same period.
The commercial aviation industry, through the Air Transport Action Group (ATAG), released its own long-term traffic forecasts in Waypoint 2050, which outlines possible decarbonization pathways. The range in their projections is smaller than ICAO’s, spanning 2.3% to 3.3% per annum between 2019 and 2050, with a central scenario at 3.1%. However, the first edition of Waypoint 2050, released in September 2020, had traffic growth scenarios between 2.7% and 3.5% per year, with the central scenario at 3.0%. Growth in the central scenario increased in the update, but values in the low and high scenarios were lowered.
The rosiest outlooks come from aircraft manufacturers, who have planes to sell and stockholders to impress. Airbus, with its Global Market Forecast (GMF), and Boeing, through its Commercial Market Outlook (CMO), produce traffic projections annually. Airbus’ most recent GMF covers the 2021-2040 period and reports that passenger traffic could return to 2019 levels between 2023 and 2025. Most importantly, GMF projects that global traffic will grow an average of 3.9% per year between 2019 and 2040. Boeing’s CMO offers a similar growth projection of 4.0% per annum over the same 22-year period.
Here’s my take. I use the Boeing CMO for my forecast but consult multiple editions to get historical traffic data for 1985-2019. I then fit second order polynomial trendlines for data starting in 1985 (the earliest data available from previous CMOs), but ending at three different years to obtain low, central, and high forecasts for 2019 through 2050, as shown in Figure 1.
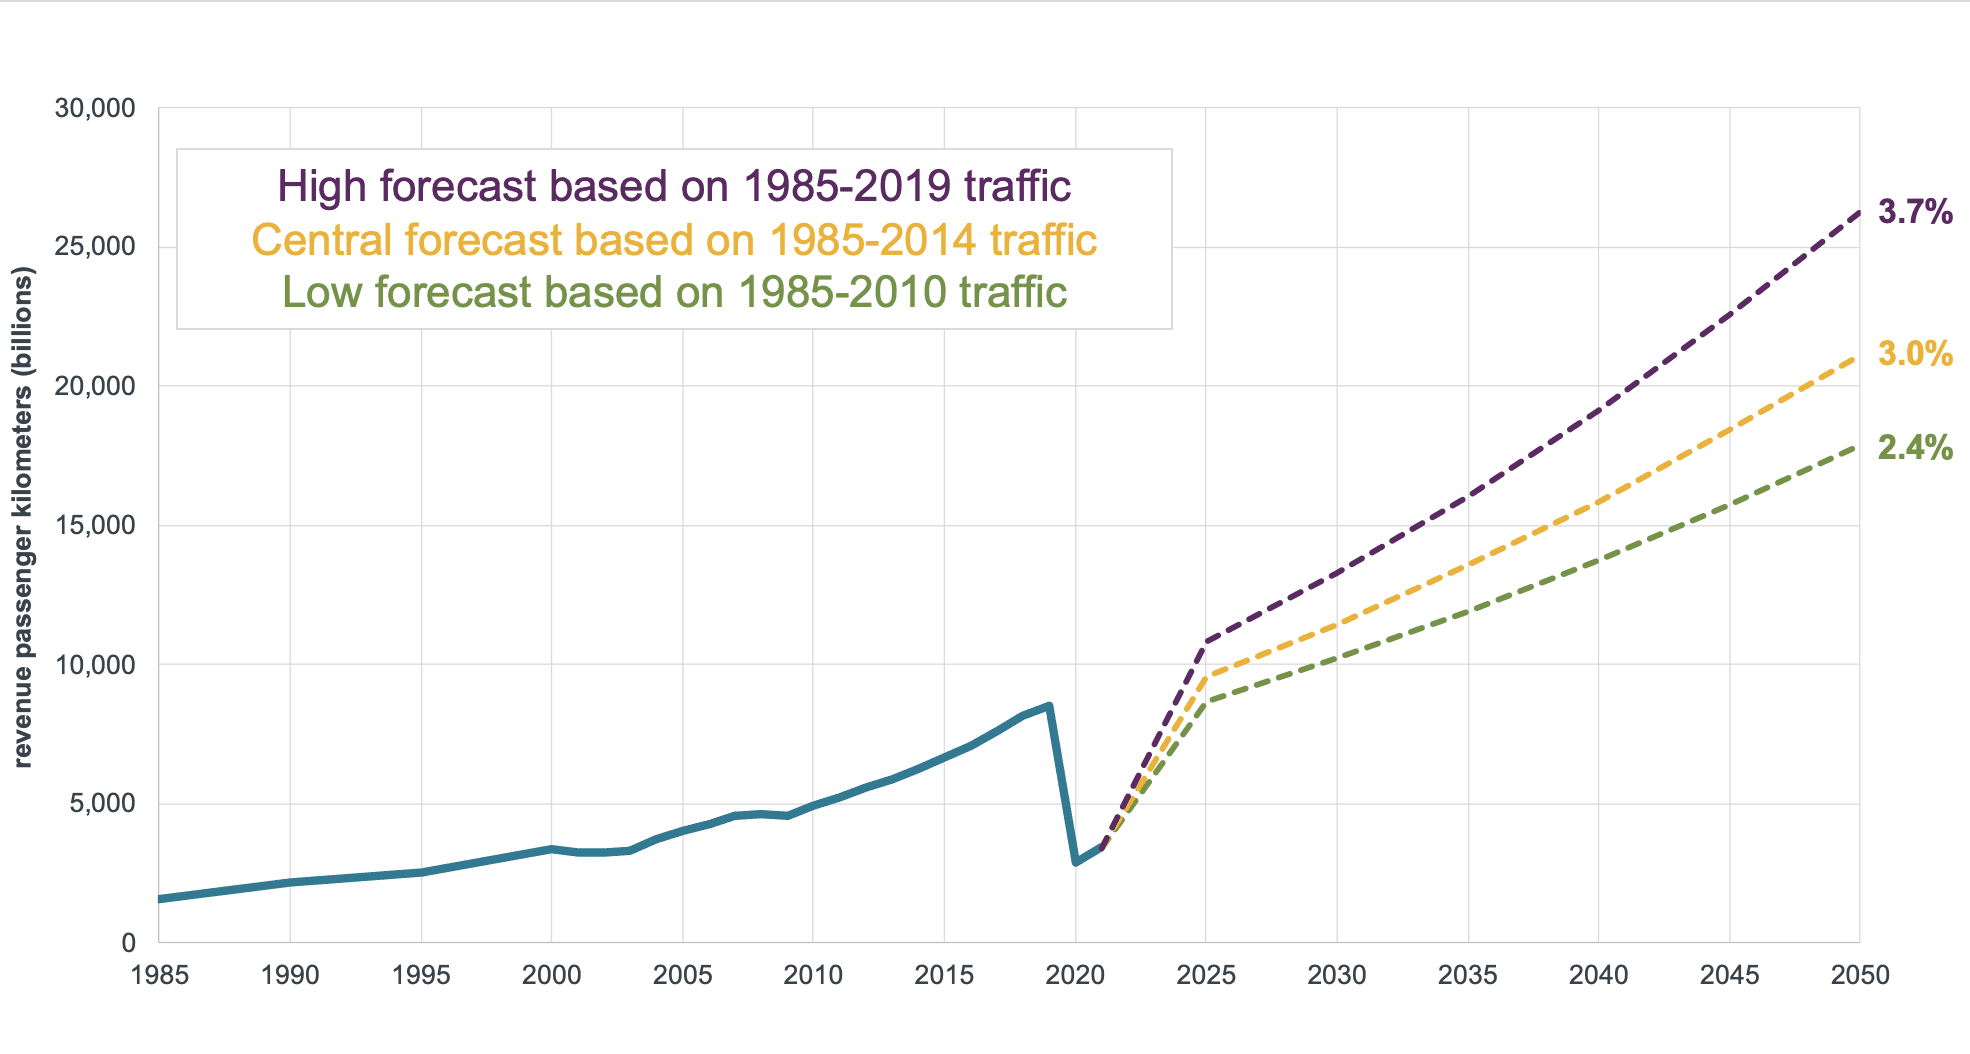
Figure 1. ICCT’s long-term passenger traffic forecast, 2019-2050
Fitting the trendline on the data for the 1985-2019 period and forecast out to 2050, you get the purple dashed line—average annual traffic growth of 3.7% per annum between 2019 and 2050, if you assume that pre-COVID traffic growth resumes in 2025. COVID-19 has the potential of having a lasting impact on long-term traffic forecasts. The Airbus GMF reported that COVID has caused a 2-year lag in traffic growth, half the lag suggested by ICAO. In addition, there may be a future decrease in travel as people and firms wrestle with their own environmental footprints.
Combing through the data for subsets that might lower forecasted traffic growth, I found a distinct acceleration in traffic growth during the 2010-2019 period, compared to 1985-2010 as we came out of the Great Recession and started traveling again. Fitting trendlines on the traffic data for 1985-2010 and 1985-2014, and forecasting out to 2050 produces my Low and Central traffic forecasts (yellow and green in Figure 1, respectively). Under the Central scenario, global passenger traffic will grow an average of 3% per year between 2019 and 2050 (5 years of lost traffic due to COVID), with a lower 2.4% per year in the Low scenario (representing changes in travel due to climate concerns). My Central scenario is also similar to ATAG’s central forecast, while my High scenario is similar to ICAO’s mid-range forecast and my Low scenario is higher than IEA’s net-zero scenario.
Table 1 summarizes the six traffic projections discussed above. Given that the forecasts have differing end years, I estimated RPKs in 2040 based on per annum traffic growth rates. While some forecasts have similar growth percentages, 2040 estimates of passenger traffic can diverge due to differing baseline RPK estimates. Using my Central scenario of 3% per annum growth between 2019 and 2040, I estimate nearly 16 trillion RPKs by 2040, nearly 25% lower than Airbus and Boeing. Differing opinions on traffic growth will lead to vastly different estimates of CO2 emissions by 2050.
Table 1. Summary of long-term passenger traffic forecasts
| Organization | Analysis period | Passenger traffic growth
(per annum) |
2040 traffic
(trillion RPKs) |
| Airbus | 2019-2040 | 3.9% | 20.0 |
| Boeing | 2019-2040 | 4.0% | 19.2 |
| ATAG | 2019-2050 | Low: 2.3%
Central: 3.1% High: 3.3% |
Central: 16.3 |
| ICAO | 2018-2050 | Low: 2.9%
Mid: 3.6% High: 4.2% |
Mid: 18.1 |
| ICCT | 2019-2050 | Low: 2.4%
Central: 3.0% High: 3.7% |
Central: 15.9 |
| IEA | 2019-2050 | NZE: 1.8%
SDS: 2.9% |
SDS: 16.2 |
Taking advantage of the trends in fuel efficiency improvements observed by my Global Aviation Carbon Assessment (GACA) between 2013 and 2019, I can quantify baseline 2050 CO2 emission estimates. Assuming no drastic changes in aircraft design or fuel that would affect emission factors, the spread between my Low and High scenarios is more than 700 million metric tonnes (Mt). To place this number in context, global commercial aviation CO2 emissions in 2019 were 915 Mt. The difference in 2050 emissions between the Central 3% per annum and High 3.7% per annum traffic forecasts is more than 400 Mt.
Passenger traffic forecasts are key inputs into any aviation decarbonization roadmap. The COVID-19 pandemic reminds us that no one can predict with certainty what the air travel industry will look like in 10, 20, or 30 years. Still, it is important to use sensible projections to analyze climate goals and the measures needed to support them. Estimate too high, and you may place unrealistic expectations on industry to develop advanced concept aircraft and sustainable aviation fuel that can bring the aviation industry to net-zero emissions. Too low, and decarbonization efforts will be feeble and fall short of the needed reductions. Long-term traffic forecasts will inevitably see revisions as time goes on, and decarbonization roadmaps will, too. We need to ensure that our emphasis is on the final decarbonization goal, with flexibility in the means of how we achieve it.