
Investment Universe, Process, Strategy and Benchmark – How does the Fund Manager invest? (ISIN: LU0382967288)
FVCM employs a value-oriented investment style known as Growth at a Reasonable Price (GARP). The portfolio consists between 25 and 35 of medium and large capitalization stocks. The three prime factors relating to this style are as follows:
GROWTH: FVCM constantly searches for stocks for investment which are expected to produce upward earnings momentum and earnings estimate revisions, but we do not limit our target universe to the fastest growing companies in an industry or sector. The key to our strategy is the requirement of expected earnings growth, but only in relationship with the second key variable, value.
VALUE: Overpaying, even for a great company, is not a strategy for investment success. Consequently, we are rigorous in applying a broad range of valuation measures appropriate to each stock under consideration for investment. At its core, we are seeking to buy a future stream of cash flows at the lowest possible price. Success is determined by a search for value.
DIVERSIFICATION: We seek to minimize the volatility of returns through proper investment in a wide range of companies, industries and economic sectors with little cross-correlation in terms of both the operations of the businesses and the stock behavior. While the concentrated portfolio of 25-to-35 companies is diverse, the common theme holding them together is the combination of growth and value.
General Points:
• Primarily a bottom-up process based on fundamental analysis of public documents in combination with top-down adjustments for risk control.
• Value-based strategy with growth overlay (GARP). Stocks never purchased based solely on valuation.
• Below market risk (as defined by both beta and standard deviation of returns).
• Portfolio consists primarily of businesses that are headquartered and operate in the U.S.
• Concentrated portfolio of 25-to-35 stocks.
• Capitalization $1 billion up to mega-cap.
• Stock positions range from 1%-to-6% weight depending on manager’s subjective determination of risk (function largely of business risk, capitalization, trade volume, etc).
• Sector weights can vary significantly vis-à-vis the S&P 500 (generally between 0.5-to-1.5 times S&P weights).
• Portfolio target toward full investment, i.e., except in special market conditions, cash generally kept to less than 5% of total value.
• Stocks not sold based solely on (over)valuation. As stocks become overvalued according to manager’s criteria, position reduced on scaled basis for risk control purposes and sold entirely if trigger event appears likely.
The portfolio is benchmarked against the S&P 500, which is a capitalization weighted index of 500 U.S. stocks. The S&P 500 consists of both “value” and “growth” stocks, and consists of companies with market capitalizations from about $1 billion (First Solar) upward to more than $500 billion (Apple).
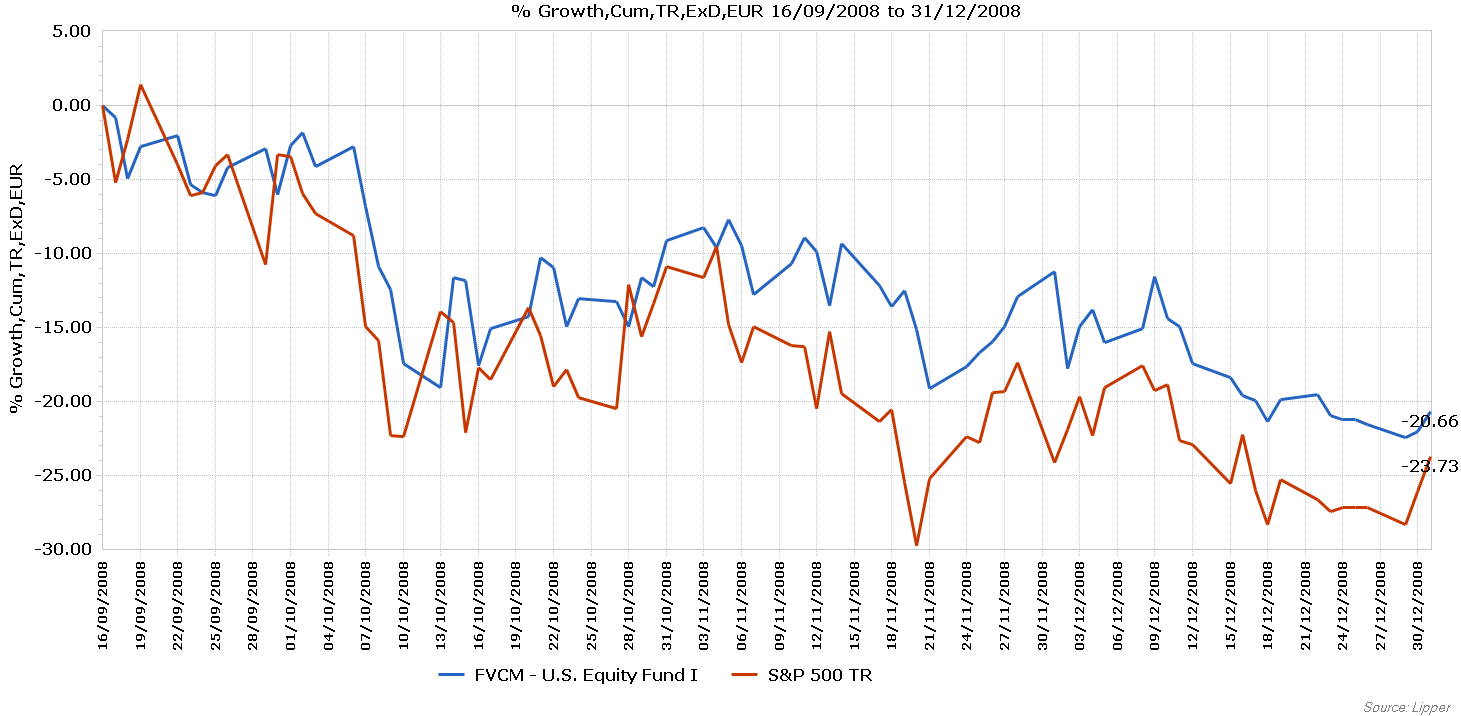
Performance Review 2008
H. Terry Riley III: "In 2008 the fund outperformed benchmark return. Recognizing the deteriorating conditions in the real estate market and the risk of losses on the balance sheets of financial firms, the portfolio manager had started to sharply reduce exposure to the financial sector in 2007. The low relative exposure to the financial sector, an over-weighted position in more defensive sectors such as healthcare, and a higher than normal cash position were the primary drivers of the outperformance."
Performance Review 2009
H. Terry Riley III: "In 2009 the fund returned 26.5%, versus a 22.5% return for the S&P 500. The fund remained underweighted in financials in 2009, which continued to underperform the broad market that year. Also, the portfolio manager began to increase exposure to cyclical businesses such as technology and basic materials on the premise that the worst of the recession was completed. Nonetheless, the manager continued to hedge exposure to cyclical names with an over-weighted position in defensive stocks in the healthcare and telecommunications sectors. Such positions helped control risk and volatility, but were also a drag on performance."
Performance Review 2010
H. Terry Riley III: "In 2010 the fund returned 19.2%, versus 23.1% for the S&P 500, with underperformance in the first half of the year and outperformance in the second half. A large exposure to industrial, energy and material stocks aided fund returns. However, early on, a continued overweighting in the defensive healthcare sector, which returned only 2.9% and underperformed the market by 12.0%, was a major drag. The improved second half performance reflected a reduction in exposure to healthcare and other defensive stocks. Furthermore, in view of the leveraged balance sheets of the U.S. consumer, the portfolio manager had small positions in the consumer discretion sector, which includes the auto industry and retail stores. These stocks turned out to be the best performing group in 2010 with a return of 27.4%, an outperformance of 12.6%. The returns for the consumer discretionary stocks reflected a rebound from very depressed levels, despite continued headwinds from a weakened U.S. consumer."
Performance Review 2011

H. Terry Riley III: "In 2011 the fund had a negative return of 13.3%, versus a return of 2.1% for the S&P 500. We have been quite optimistic about equities since early 2009 because of the chances that were presented to buy stocks very cheaply as the economy climbed out of the deep recession. Our optimism was proven correct as the index nearly doubled off the market bottom going into early 2011. However, unforeseen problems began to spring up and the performance of our equity portfolios suffered starting in the second quarter of 2011. The Japanese crisis, the sovereign debt and banking problems in Europe, China’s attempt to dampen its real estate markets and inflation, and the end of QE2 in the U.S. were among the factors why many investors reduced risk exposure and contributed to a minor mid-term correction in stock prices. The fund had been positioned to take advantage of ongoing growth in the global economy with overweight positions in industrials, technology and materials stocks. Such sector weights had a negative impact on the fund as compared to the S&P 500. Also, the strategy utilized by the fund manager is a value-based strategy and value stocks uncharacteristically lagged high-priced growth stocks."
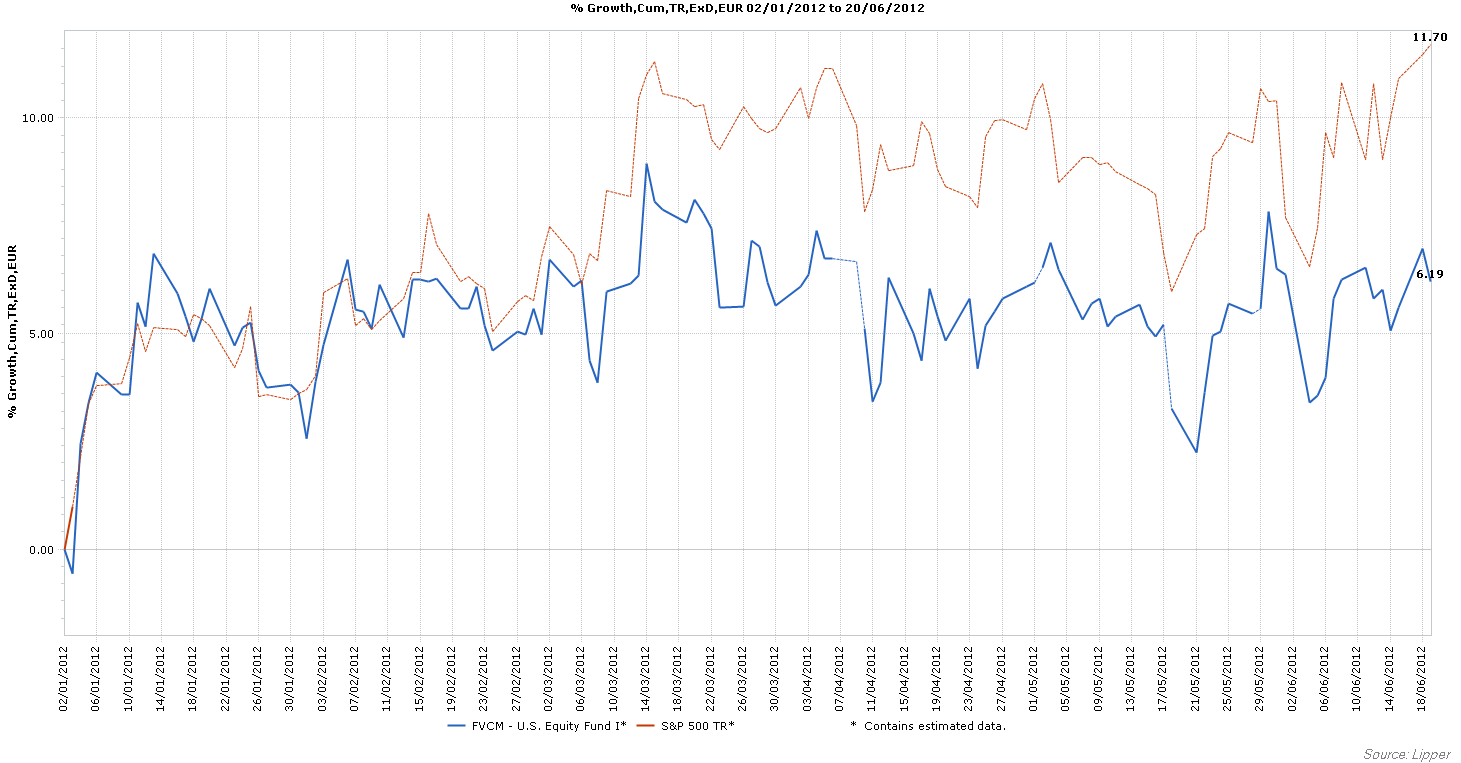
Performance 2012 - Year-to-Date
H. Terry Riley III: "The fund continued to trail the S&P 500 during the first five months of 2012 with a return of 1.21%, versus 5.15% for the benchmark. Value stocks continued to trail higher priced growth stocks due to lingering concerns about the global economic expansion. However, the manager believes that the gap in valuations between growth and value stocks is creating a tension that will ultimately result in value strategies again asserting strong relative performance. Furthermore, while the U.S. and Europe may continue to experience modest growth rates due to the dampening effects from deleveraging consumers, recent declines in inflation will allow emerging economies to re-stimulate their economies. Further monetary stimulus in the U.S., Europe and Japan is also quite possible, if not likely. Accordingly, the portfolio manager has positioned the portfolio to take advantage of U.S. corporations that have competitive advantage and will benefit from ongoing global growth."
Performance since 2008
Weitere beliebte Meldungen:


