

Durchschnittliche Performance-Entwicklung lag im November bei +0,49 Prozent
Die wichtigsten Entwicklungen im November kurz zusammengefasst: Im Durchschnitt über alle 286 von e-fundresearch.com in der Morningstar Direct Datenbank untersuchten Fondskategorien konnte im letzten Kalendermonat November aus Sicht eines EUR-Investors eine Performance-Entwicklung von 0,49 Prozent gemessen werden. 51,4 Prozent der Kategorien beendeten den November mit einer positiven Wertentwicklung - die Bandbreite der beobachteten Erträge bewegte sich dabei in einem Spektrum von -18,59 Prozent (schwächste Kategorie - Commodities - Energy) bis 10,56 Prozent (stärkste Kategorie - Indonesia Equity).
Folgende Tabelle präsentiert jene Top- und Flop-10-Fondskategorien, die im November die stärkste beziehungsweise schwächste Wertentwicklung verzeichneten:
| Top-10 Fondskategorien: November 2018 | |
| Fondskategorie | November-P in % |
| Indonesia Equity | 10,56% |
| Turkey Equity | 10,18% |
| ZAR/NAD Diversified Bond | 9,94% |
| IDR Allocation | 9,34% |
| India Equity | 9,28% |
| IDR Bond | 8,86% |
| ZAR/NAD Bond - Ultra Short Term | 7,42% |
| ZAR/NAD Flexible Bond | 7,29% |
| ZAR/NAD Bond - Short Term | 7,24% |
| ZAR/NAD Money Market | 6,66% |
| Flop-10 Fondskategorien: November 2018 | |
| Fondskategorie | November-P in % |
| Commodities - Energy | -18,59% |
| Norway Equity | -5,32% |
| Switzerland Small/Mid-Cap Equity | -4,08% |
| Sector Equity Energy | -3,58% |
| France Small/Mid-Cap Equity | -3,53% |
| Commodities - Broad Basket | -3,28% |
| GBP Inflation-Linked Bond | -3,15% |
| Finland Equity | -3,07% |
| Sector Equity Natural Resources | -3,00% |
| Europe ex-UK Small/Mid-Cap Equity | -2,80% |


Nur 27,62 Prozent der Fondskategorien seit Jahresbeginn positiv
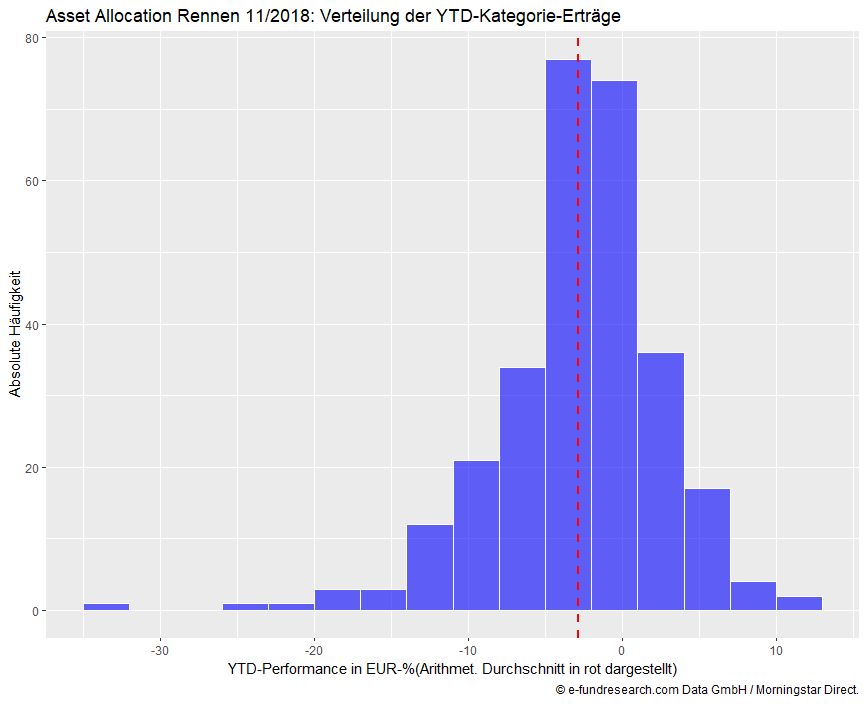
Auf Sicht seit Jahresbeginn (Year-to-Date) zeichnet sich per Ende November folgendes Bild: Mit einem Anteil positiver Fondskategorien von lediglich 27,62 Prozent muss für die Mehrheit der untersuchten Fondskategorien eine negative Year-to-Date Entwicklung (in EUR) festgestellt werden. Das Spektrum der beobachteten Year-to-Date Performances bewegt sich zum aktuellen Stichtag im Bereich von -33,95 Prozent (schwächste Fondskategorie seit Jahresbeginn - Turkey Equity) bis 11 Prozent (stärkste Fondskategorie seit Jahresbeginn - Sector Equity Healthcare) - der über alle Fondskategorien gemessene (arithmetische) YtD-Performance-Durchschnitt liegt aktuell bei -2,87 Prozent, die Median-Ertragsentwicklung liegt bei -2,27 Prozent.
Nachfolgend eingefügte Tabellen präsentieren die aktuellen Top- und Flop-10-Fondskategorien seit Jahresbeginn:
| Top-10 Fondskategorien seit Jahresbeginn | |
| Fondskategorie | YtD-P in % |
| Sector Equity Healthcare | 11,00% |
| US Large-Cap Growth Equity | 10,83% |
| USD Money Market - Short Term | 7,51% |
| USD Money Market | 7,50% |
| US Large-Cap Blend Equity | 7,31% |
| US Small-Cap Equity | 7,01% |
| USD Diversified Bond - Short Term | 6,49% |
| Property - Indirect North America | 6,45% |
| Sector Equity Utilities | 6,05% |
| US Flex-Cap Equity | 5,89% |
| Flop-10 Fondskategorien seit Jahresbeginn | |
| Fondskategorie | YtD-P in % |
| Turkey Equity | -33,95% |
| Property - Indirect South Africa & Namibia | -25,28% |
| China Equity - A Shares | -20,31% |
| Sector Equity Precious Metals | -19,42% |
| France Small/Mid-Cap Equity | -18,66% |
| South Africa & Namibia Small-Cap Equity | -17,02% |
| Poland Equity | -16,53% |
| South Africa & Namibia Equity | -15,32% |
| Eurozone Small-Cap Equity | -15,15% |
| Korea Equity | -13,96% |
Performance-Update der wichtigsten Fondskategorien
Nachdem die oben dargestellten Top- und Flop-Tabellen auch zahlreiche 'exotischere' Fondskategorien enthalten, die in der Praxis maximal in Form von Satelliten-Allokationen berücksichtigt werden, haben wir Ihnen in den folgenden Tabellen die aktuellsten Performance-Entwicklungen (seit Jahresbeginn / sowie die Entwicklung im Kalendermonat November) der jeweils größten 1) Aktienfonds-, 2) Anleihefonds- sowie 3) Multi Asset Fondskategorien übersichtlich zusammengefasst:
| 1) Ausgewählte Aktienfondskategorien: EUR-Performance Update | ||
| Fondskategorie | YtD-P in % | November-P in % |
| Global | ||
| Global Equity Income | -0,02% | 1,11% |
| Global Flex-Cap Equity | -4,18% | -0,12% |
| Global Large-Cap Blend Equity | -0,46% | 0,75% |
| Global Large-Cap Growth Equity | 1,85% | 1,41% |
| Global Large-Cap Value Equity | -1,70% | 0,39% |
| Global Small-Cap Equity | -2,75% | 0,16% |
| USA | ||
| US Flex-Cap Equity | 5,89% | 1,53% |
| US Large-Cap Blend Equity | 7,31% | 1,19% |
| US Large-Cap Growth Equity | 10,83% | 1,12% |
| US Large-Cap Value Equity | 5,72% | 1,65% |
| US Mid-Cap Equity | 5,49% | 1,94% |
| US Small-Cap Equity | 7,01% | 0,63% |
| Europa / Eurozone | ||
| Europe Equity Income | -6,27% | -0,50% |
| Europe ex-UK Large-Cap Equity | -6,87% | -0,92% |
| Europe ex-UK Small/Mid-Cap Equity | -11,25% | -2,80% |
| Europe Flex-Cap Equity | -9,56% | -1,63% |
| Europe Large-Cap Blend Equity | -7,22% | -1,16% |
| Europe Large-Cap Growth Equity | -5,21% | -1,49% |
| Europe Large-Cap Value Equity | -8,43% | -0,96% |
| Europe Mid-Cap Equity | -9,46% | -2,75% |
| Europe Small-Cap Equity | -12,62% | -2,66% |
| Eurozone Large-Cap Equity | -8,24% | -0,84% |
| Eurozone Mid-Cap Equity | -13,02% | -2,65% |
| Emerging Markets / Frontier Markets | ||
| Global Emerging Markets Equity | -8,89% | 3,93% |
| Global Emerging Markets Small/Mid-Cap Equity | -11,53% | 4,71% |
| Emerging Europe Equity | -7,05% | 2,28% |
| Emerging Europe ex-Russia Equity | -8,14% | 3,71% |
| Global Frontier Markets Equity | -10,53% | 1,10% |
| India Equity | -8,25% | 9,28% |
| Latin America Equity | -2,27% | -0,77% |
| Russia Equity | 1,64% | -0,54% |
| China Equity | -11,41% | 4,86% |
| China Equity - A Shares | -20,31% | 0,43% |
| Brazil Equity | 4,50% | -0,67% |
| BRIC Equity | -1,63% | 4,40% |
| DACH-Region | ||
| Austria Equity | -10,14% | -0,76% |
| Germany Large-Cap Equity | -13,78% | -1,40% |
| Germany Small/Mid-Cap Equity | -13,02% | -1,97% |
| Switzerland Large-Cap Equity | -1,32% | -0,79% |
| Switzerland Small/Mid-Cap Equity | -8,76% | -4,08% |
| Asien / Japan | ||
| ASEAN Equity | -5,59% | 3,11% |
| Asia ex Japan Equity | -9,45% | 5,09% |
| Asia ex-Japan Small/Mid-Cap Equity | -11,66% | 5,35% |
| Asia-Pacific ex-Japan Equity | -6,91% | 4,35% |
| Asia-Pacific ex-Japan Equity Income | -4,26% | 3,21% |
| Japan Flex-Cap Equity | -5,97% | 1,01% |
| Japan Large-Cap Equity | -3,39% | 0,43% |
| Japan Small/Mid-Cap Equity | -3,92% | 1,68% |
| 2) Ausgewählte Anleihefondskategorien: EUR-Performance Update | ||
| Fondskategorie | YtD-P in % | November-P in % |
| Global | ||
| Global Bond | 0,90% | 0,13% |
| Global Bond - CHF Hedged | 0,80% | 0,67% |
| Global Bond - EUR Biased | -1,99% | -0,37% |
| Global Bond - EUR Hedged | -3,11% | -0,10% |
| Global Flexible Bond | -0,49% | -0,59% |
| Global Flexible Bond - CHF Hedged | -0,88% | -0,03% |
| Global Flexible Bond - EUR Hedged | -3,89% | -0,8% |
| EUR / Europe | ||
| EUR Bond - Long Term | 1,15% | 0,37% |
| EUR Diversified Bond | -1,84% | -0,23% |
| EUR Diversified Bond - Short Term | -1,55% | -0,27% |
| EUR Flexible Bond | -2,94% | -0,76% |
| EUR Government Bond | -0,66% | 0,34% |
| EUR Government Bond - Short Term | -0,78% | 0,15% |
| Europe Bond | -1,78% | -0,16% |
| USD / USA | ||
| USD Diversified Bond | 3,69% | 0,29% |
| USD Diversified Bond - Short Term | 6,49% | 0,07% |
| USD Flexible Bond | 3,34% | -0,33% |
| USD Government Bond | 3,98% | 0,69% |
| Emerging Markets | ||
| Global Emerging Markets Bond | -1,66% | -0,30% |
| Global Emerging Markets Bond - EUR Biased | -8,44% | -0,75% |
| Global Emerging Markets Bond - Local Currency | -3,51% | 2,33% |
| Global Emerging Markets Corporate Bond | 0,90% | -0,52% |
| Global Emerging Markets Corporate Bond - EUR Biased | -6,11% | -0,82% |
| Emerging Europe Bond | -3,74% | 1,10% |
| Asia Bond | 1,77% | 0,41% |
| Asia Bond - Local Currency | 2,21% | 3,36% |
| RMB Bond | 1,54% | 0,73% |
| RMB Bond - Onshore | 2,98% | 1,06% |
| Corporates | ||
| USD Corporate Bond | 2,46% | -0,23% |
| Global Corporate Bond | 0,21% | -0,48% |
| Global Corporate Bond - CHF Hedged | -1,54% | 0,11% |
| Global Corporate Bond - EUR Hedged | -4,56% | -0,68% |
| EUR Corporate Bond | -2,27% | -0,69% |
| EUR Corporate Bond - Short Term | -1,37% | -0,50% |
| High Yield | ||
| Asia High Yield Bond | -0,67% | -0,03% |
| EUR High Yield Bond | -3,45% | -1,88% |
| Global High Yield Bond | 3,45% | -1,00% |
| Global High Yield Bond - CHF Hedged | -0,39% | -0,60% |
| Global High Yield Bond - EUR Hedged | -4,20% | -1,35% |
| USD High Yield Bond | 4,97% | -0,78% |
| 3) Ausgewählte Multi-Asset Kategorien: EUR-Performance Update | ||
| Fondskategorie | YtD-P in % | November-P in % |
| EUR | ||
| EUR Aggressive Allocation | -6,48% | -0,61% |
| EUR Aggressive Allocation - Global | -4,37% | 0,31% |
| EUR Cautious Allocation | -3,43% | -0,38% |
| EUR Cautious Allocation - Global | -3,42% | -0,21% |
| EUR Flexible Allocation | -6,63% | -0,62% |
| EUR Flexible Allocation - Global | -5,23% | -0,22% |
| EUR Moderate Allocation | -5,34% | -0,53% |
| EUR Moderate Allocation - Global | -3,80% | 0,03% |
| CHF | ||
| CHF Cautious Allocation | -0,19% | 0,42% |
| CHF Moderate Allocation | -1,34% | 0,37% |
| USD | ||
| USD Aggressive Allocation | 1,26% | 1,04% |
| USD Cautious Allocation | 3,09% | 0,16% |
| USD Flexible Allocation | 0,87% | 0,37% |
| USD Moderate Allocation | 2,15% | 0,53% |
| Emerging Markets | ||
| Global Emerging Markets Allocation | -7,72% | 1,82% |
Methodik des e-fundresearch.com Asset Allocation Rennens: Im Rahmen des e-fundresearch.com Asset Allocation Rennens werden im monatlichen Intervall die EUR-Erträge (Year-to-Date sowie letztes Kalendermonat) sämtlicher Morningstar-Fondskategorien gemessen, die über zumindest 5 aktive und zugeordnete Fondsstrategien verfügen. Datenquelle: e-fundresearch.com Data GmbH, Morningstar Direct.
Weitere beliebte Meldungen:


