A higher volatility regime
In our inaugural Asset Allocation Quarterly, we named ‘higher volatility’ a core investment theme for coming months. Specifically, we said ‘as the cycle matures, the range of potential growth, inflation and interest rate outcomes is broadening from the very narrow range investors have been used to for much of the past decade post-financial crisis.’ The sharp rise in market volatility in October was a particularly acute illustration of this changing environment. And while we do expect volatility to calm somewhat from elevated levels over coming weeks, we also think the overall ‘volatility regime’ will be structurally higher than what investors have been used to over recent years. This does not mean we are of the view a bear market has begun—we do not think it has. But October’s price action is a reminder that returns in multi-asset portfolios are likely to be more muted on a risk-adjusted basis, and portfolio management will probably require more tactical positioning as we move into the late stages of the economic cycle. In this Macro Monthly we discuss our views on recent market volatility, why we believe we are in a higher volatility regime, and how we are navigating this environment in our portfolios.
What happened?
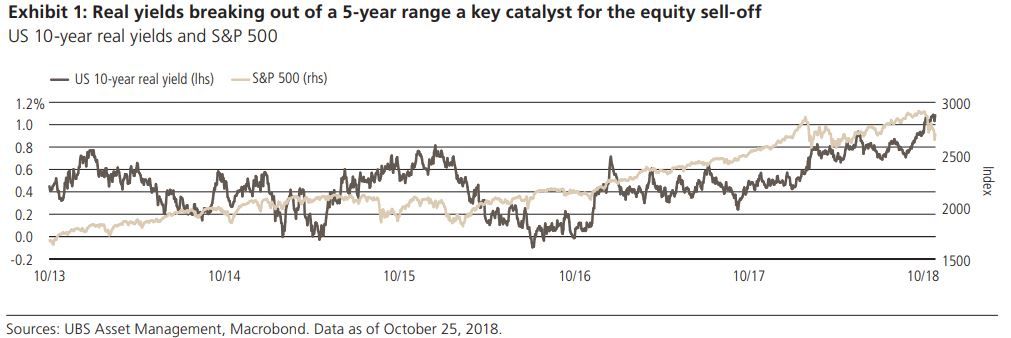
Since reaching an all-time closing high on September 20th, the S&P 500 underwent a 10% correction, bringing year-to-date performance flat for the year. Global equity markets have fallen largely in line, although most major indices outside of the U.S. were already down year-to-date, pressured by moderating ex-US growth, associated concerns of China’s deleveraging, and perceptions that trade tensions will weigh on exports and company earnings. The proximate catalyst for the sell-off was a sharp rise in US 10-year Treasury yields (about 40 bps over 6 weeks), driven largely by more hawkish guidance from the US Federal Reserve. In particular, it was the breakout in 10-year real, or inflation-adjusted, yields to 5-year highs which began to challenge market valuations and assumptions about how high interest rates can go (Exhibit 1). More recently, concerns about ‘peak earnings’ and fears that this long economic expansion will soon come to an end have added to the selling pressure. While Q3 earnings and guidance have not been particularly negative, the smaller proportion of revenue beats relative to recent quarters and commentary on rising labor and raw material input costs have led to a reassessment of the multiple investors are willing to pay for future earnings estimates. And in the background, US-China trade concerns, US political uncertainty and tensions between Italy’s populist government and the EU have all contributed to shaky markets.
Entering a higher volatility regime
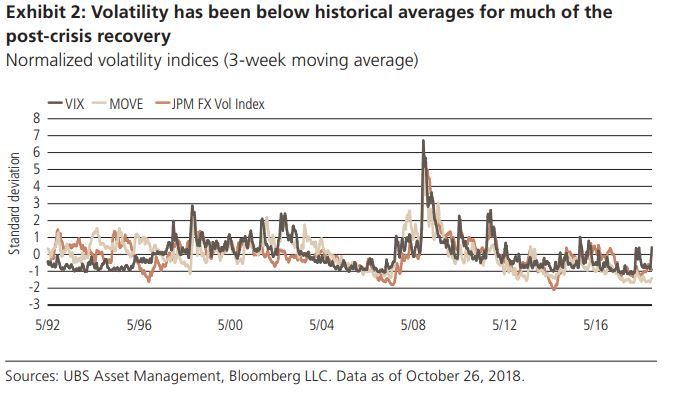
But the overarching picture here is that market volatility has been suppressed by low macro variability (growth and inflation) and accommodative monetary policy for years, and that pressure is now starting to release (Exhibit 2). As central banks remove accommodation and the uncertainty over growth and inflation rises, markets will naturally become jumpier as they price in a wider variety of future outcomes. With the unemployment rate the lowest it has been in 50 years, the market must price some probability of an acceleration in inflation, just as it must also price in some possibility of a sharp downturn. And the Fed has the unenviable job of threading the needle to engineer a soft landing.
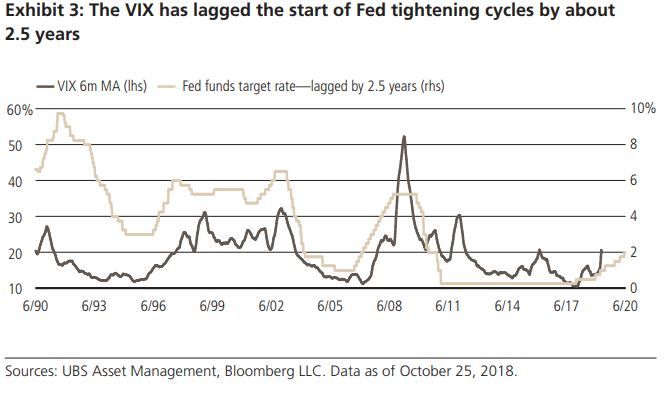
The Fed’s job gets more difficult the more it progresses in this tightening cycle and comes close to unobservable variables like R*, the real short term interest rate that should prevail when the economy is at equilibrium, and markets must price in that uncertainty. Exhibit 3 shows how historically equity market volatility has tended to lag the start of Fed tightening cycles by a couple of years. In truth, the objective of tightening monetary policy is indeed to also tighten broader financial conditions, thereby ensuring the economy and financial markets do not overheat.
Exhibit 4 shows how for much of this Fed tightening cycle, broad financial conditions have actually eased. With the latest spread of financial stress, one could argue the Fed is now finally achieving its goals. But fears of a Fed policy mistake will rise the more the Fed continues on its rate path, if not matched by a still strong economy. And there are few signs that geopolitical concerns are going away, with US-China tensions broadening more explicitly from the trade deficit to concerns about security and geopolitics. In short, we believe that genuine uncertainties on the macroeconomic outlook will stay with us, and markets will likely remain bumpy trying to price all of these factors in.
Where do we go from here?
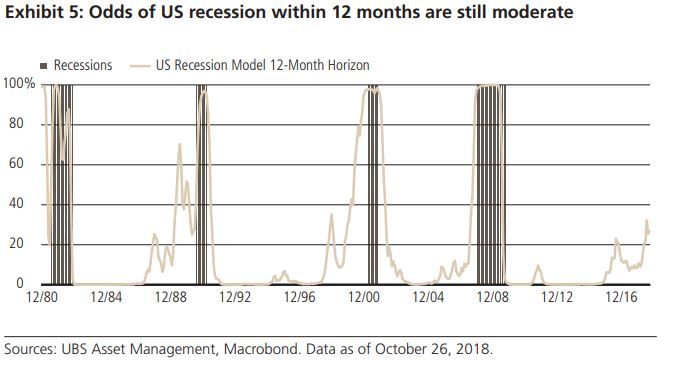
While markets will likely show more volatility, we are of the view that we are closer to the end of this drawdown than the beginning. While 10% corrections in the S&P 500 are quite common historically, it is rare to have a bear market (greater than 20% drawdown) outside of recessions. Since 1970, there has only been one S&P 500 bear market outside of a recession, which was Black Monday, October 19th 1987. At this point, most leading economic indicators in the US are still robust, and our proprietary recession probability model (Exhibit 5) signals about a 1 in 4 chance of a recession over the next 12 months—not negligible, but not our base case. In the meantime, China’s authorities have announced a series of monetary, fiscal and regulatory easing measures which should cushion the world’s second largest economy and have stabilizing knock-on effects for trade-sensitive economies from emerging markets to Europe. As the evidence of these measures begins to take hold in the data over coming months, we’d expect markets to stabilize. So while further declines in the S&P 500 are quite possible, we do not at this point expect a 20% bear market or worse. In our view, this will end up being a re-pricing, as opposed to the beginning of the end of the economic cycle. Our judgment would change if US and global economic data show genuine signs of deterioration, or if credit spreads (typically a leading indicator for a turn in the economic cycle), start to widen out much more severely.
Evan Brown, Head of Macro Asset Allocation Strategy & Roland Czerniawski Asset Allocation Analyst, Investment Solutions


