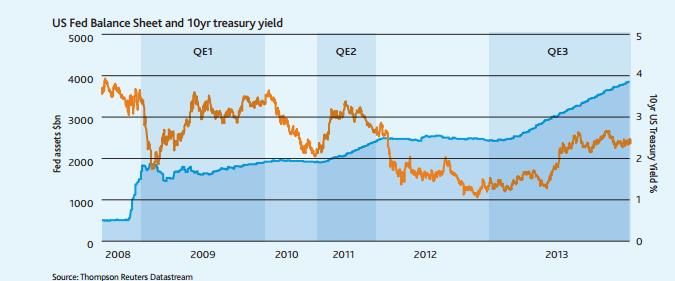
To an extent the question depends on your perspective. Throughout most of last year there was considerable speculation about when the Federal Reserve (Fed) would start to reduce its purchases of government bonds and mortgages, a strategy intended to suppress interest rates and aid the economy’s recovery. The chart above shows the spectacular increase in the Fed’s balance sheet with each stage of QE. Since 2007, total assets have risen from 6% of US gross domestic product (GDP) to 24.7% based upon Fed data. As the chart also shows, the action of buying Treasuries and mortgage backed securities has been to keep bond yields down. The 10 year US Treasury bond yield hit its lowest level of around 1.4% in July 2012. But, as we know, the role of markets is to anticipate future events.
In May 2013, market participants clearly interpreted the Fed’s forward guidance on the timing of a reduction or “tapering” in asset purchases as a tightening in monetary conditions. Bond markets reacted to Ben Bernanke’s words with a move of 220 basis points upwards in the 10 year US Treasury yield from 1.7% in May to 2.9% by August of 2013, the greatest change in 10 years. Consequently, prospective home buyers saw their mortgage costs rise and the level of mortgage approvals fall. However, at the Fed, the official funds rate was unchanged and ten months on remains close to zero. Short rates have not officially changed but tapering has indeed been tightening at the longer end of the US government yield curve.
When the Fed ended QE1 and QE2, there were declines in the S&P 500 index of 15% and 23% respectively (although cause and effect have yet to be proved). Just as each announcement of QE was followed by asset price increases so news of shift towards monetary normalisation was bound to affect markets. So it should not have been a surprise to see markets react negatively to the news last May that the Fed would be slowly reducing the size of its asset purchase programme.
Financial history provides numerous examples of times when changes in the direction of Fed policy, such as 1994 and 2003 for example, led to sharp adjustments in the yield curve. Indeed Liberty Street Economics (5 August 2013) estimated there have been 31 US Treasury market sell-offs since 1961 with last year’s being the 13th largestsell-off in that period. However, the most damaging example of a change in Fed policy was during the Great depression of the 1930s, when the authorities raised interest rates too early and threw the tentative recovery into reverse.
Continue reading in the April 2014 Global Investment Outlook from Aberdeen Asset Management


