

Total S.A. (Total), a top-tier international oil and gas company, presented their macro outlook for the global oil market at an investor update meeting on 22 September 2016. Total provided some intriguing oil supply/demand data that, if confirmed, may offer considerable medium-term upside for energy market investors.
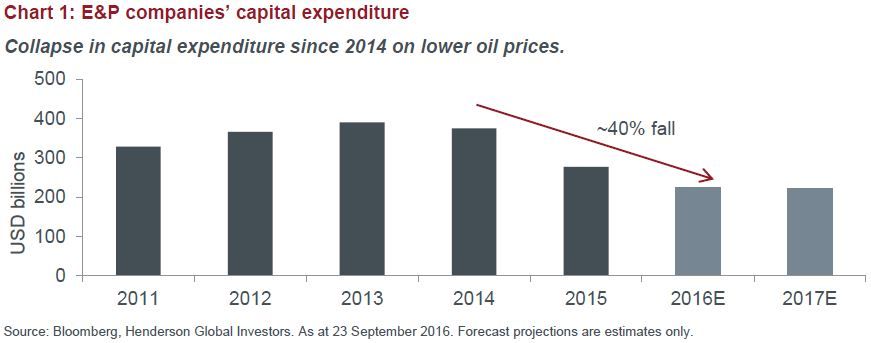
Total forecast that by 2020 there will be a 5-10mn barrel per day global oil production deficit (most likely 7mn barrels of oil per day). Total believe that the oil industry has responded to the sharp fall in the oil price (since mid-2014) by significantly cutting capital expenditures. Total claim that overall industry capital expenditure in 2014 was $700bn and forecast it will drop to $400bn in 2016 – a 43% reduction. At the same time, the natural oil field decline rate is running at close to 5% per annum, with global demand likely to continue to grow, rising by at least 1% per annum.
Potential oil price impact
A deficit of 7mn barrels of oil equivalent per day ((MMboe)/day) would be very meaningful and crude prices would need to rise significantly from current levels in order to stimulate additional capital expenditure to arrest the anticipated production decline. To put this number into context, Saudi crude oil production in August 2016 was 10.6mn barrels of oil ((MMbbl)/day) with OPEC production at 33.2 MMbbl/day and total liquids production in the United States at 13.6 MMbbl/day.
Henderson Global Natural Resources Team (Team) analysis
Where data is available, bottom-up analysis of the exploration and production oil and gas energy stocks in the S&P Global Natural Resources Index (E&P companies), confirms that Total’s thesis is indeed plausible. From 19 E&P companies, the Team calculated a reduction in capital expenditure by these large, listed companies of 40% from 2014 to 2016E. This is remarkably similar to Total’s 43% worldwide trend estimate.
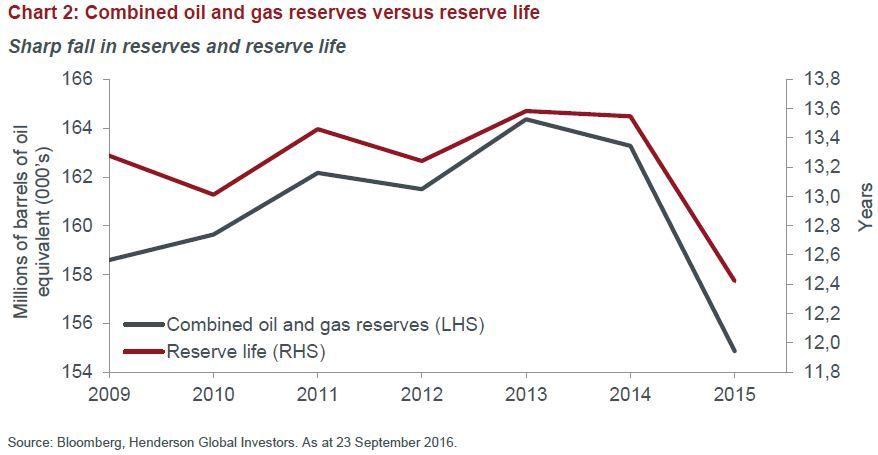
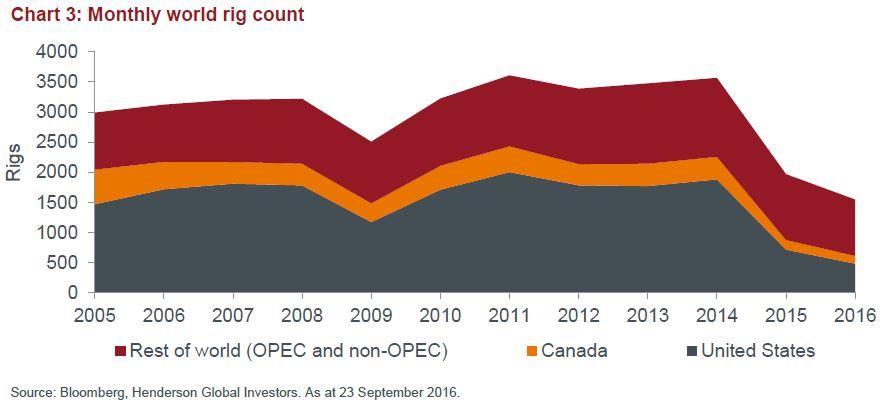
Worldwide drilling rig count numbers (a leading indicator to discovery), reserve replacement and future production also point to significant falls. Longer-term, this supply reduction will have a significant impact on the supply/demand equation if the current low global rig rate is sustained.
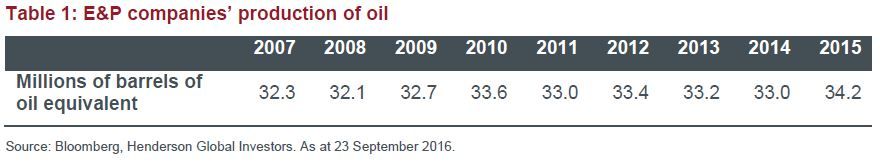
This collapse in oil and gas capital expenditure is now starting to impact production output, oil field decline rates and reserves.
This cycle is unlikely to be different from numerous previous cycles. The simple premise is that to meet demand, a return to higher oil prices is needed to attract the required levels of new investment.
The Team believe that there are considerable opportunities in the oil sector in the medium-to-longer-term and that energy stock sentiment will at some stage respond accordingly.
David Whitten, Head of Global Natural Resources, Henderson Global Investors
Weitere beliebte Meldungen:


