
Auch Fonds mussten im Monat Juni größtenteils herbe Verluste hinnehmen: Im Durschschnitt über alle Assetklassen verzeichneten Fonds im letzten Monat einen Wertverlust von -3.4 Prozent. Am stärksten hat es hierbei Aktienfonds getroffen, die im Durchschnitt über alle Kategorien knapp -5.2 Prozent verloren. Gold- und Edelmetall Aktienfonds hat es erneut am heftigsten getroffen, sie verloren beinah ein Fünftel ihres Wertes (-19.83 Prozent Juni-Performance). Am besten abschneiden konnten im Juni Japan Immobilienaktienfonds, die um +3.05 Prozent zulegen konnten.
Die starken Wertverluste im Juni haben einen Großteil der seit Jahresbeginn erwirtschafteten Performance zunichte gemacht. Während im Durchschnitt über alle Assetklassen per 31.05.2013 noch ein sattes Plus von deutlich über 3 Prozent festgehalten wurde, so muss nun ein knappes Minus von 0.06 Prozent hingenommen werden. Folgende Darstellungen und Tabellen enthalten weitere Details über die YTD-Performance nach Assetklassen:
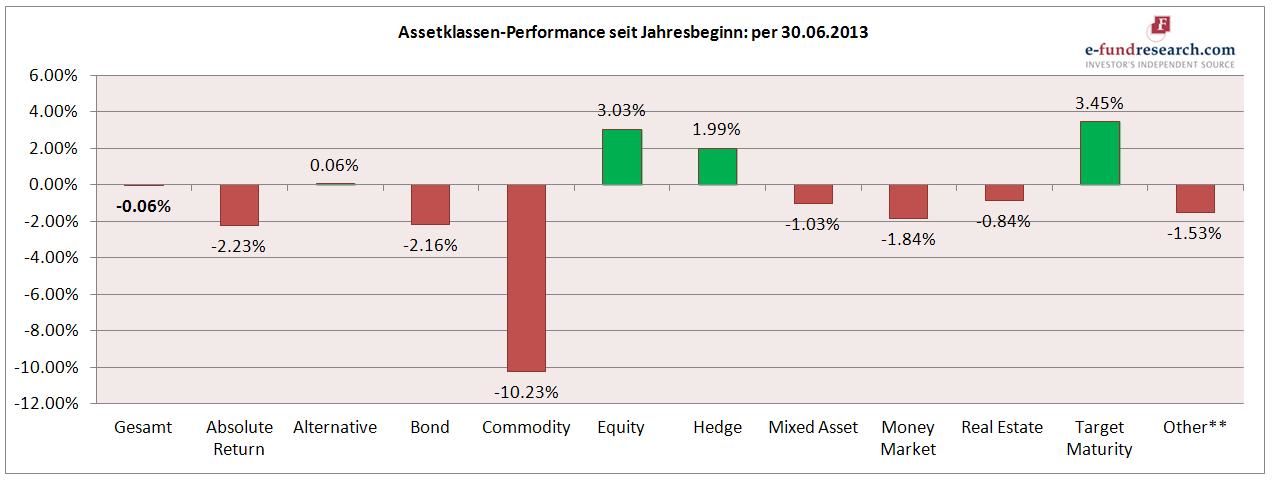
Für Aktienfonds kann auf YTD-Sicht zwar immer noch ein Plus von über 3 Prozent verzeichnet werden, verglichen mit dem Wert per 31.05.2013 (damals + 9.07 Prozent) dennoch ein herber Rückschlag.

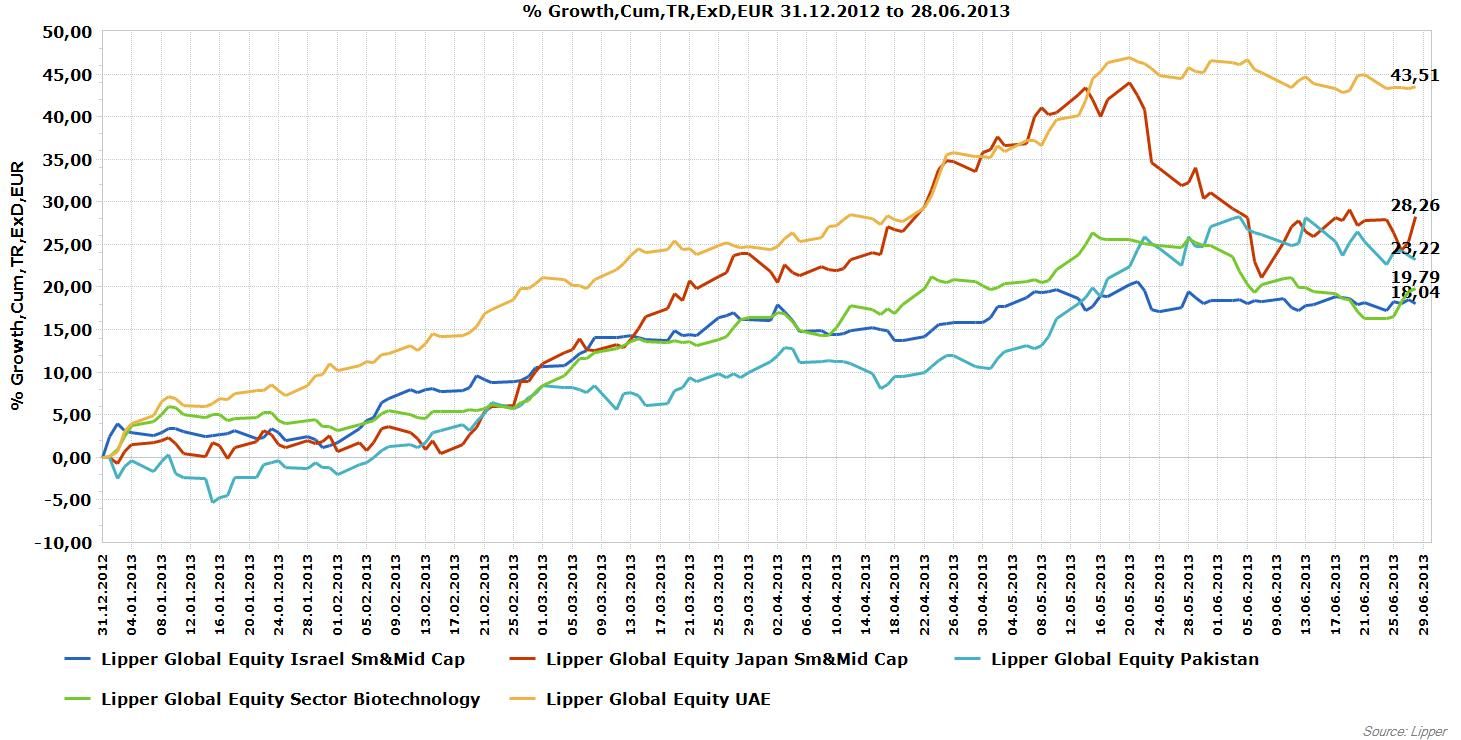
Top-5 Assetklassen: Vereinigte Arabische Emirate Top
| Platz 1: Equity UAE (+43.51 Prozent) |
| Platz 2: Equity Japan Sm&Mid Cap (+28.26 Prozent) |
| Platz 3: Equity Pakistan (+23.22 Prozent) |
| Platz 4: Equity Sector Biotechnology (+19.79 Prozent) |
| Platz 5: Equity Israel Sm&Mid Cap (+18.04 Prozent) |
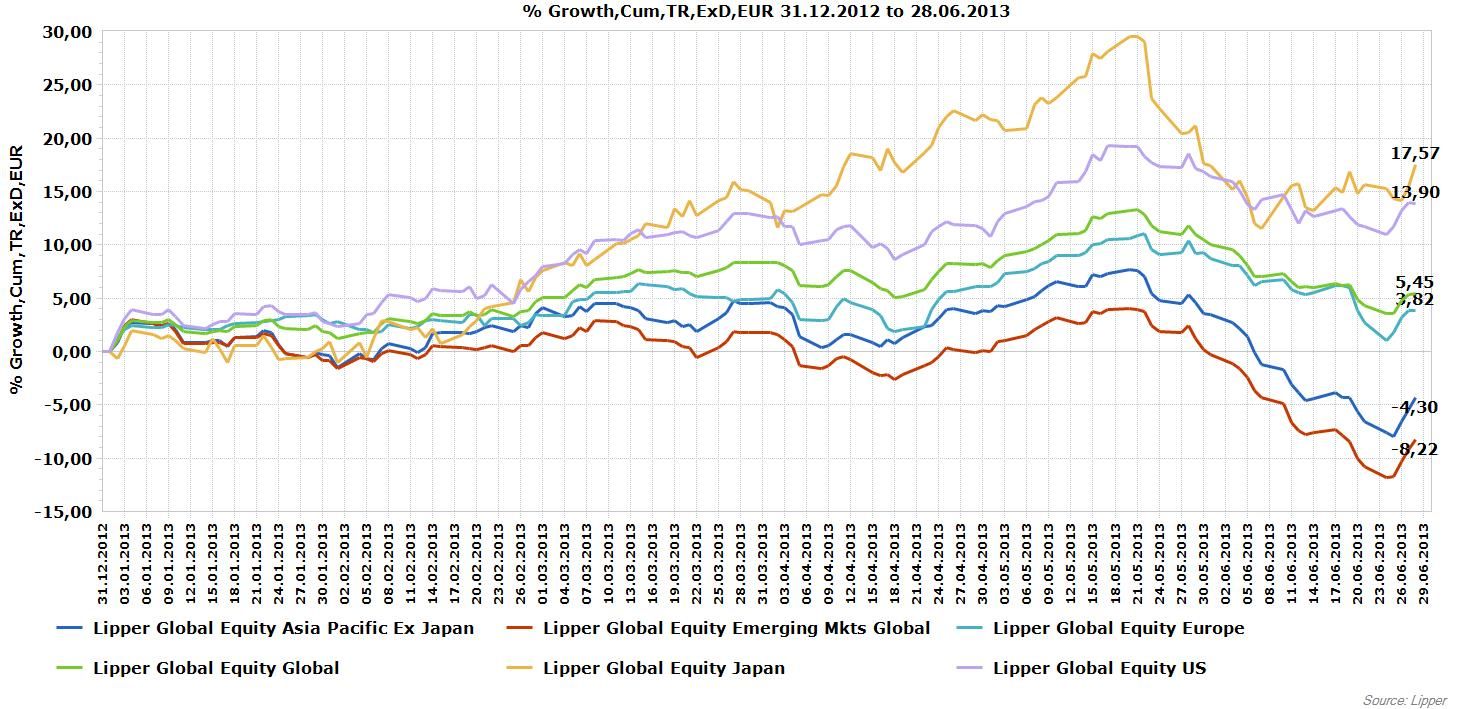
Performance wichtiger Aktienfondskategorien
| Platz 6: Equity Japan (+17.57 Prozent) |
| Platz 15: Equity US (+13.9 Prozent) |
| Platz 76: Equity Global (+5.45 Prozent) |
| Platz 101: Equity Europe (+3.82 Prozent) |
| Platz 351: Equity Asia Pacific Ex Japan (-4.3 Prozent) |
| Platz 412: Equity Emerging Mkts Global (-8.22 Prozent) |
| Platz 16: Bond Convertibles Japan (+13.5 Prozent) |
| Platz 22: Bond Convertibles US (+10.23 Prozent) |
| Platz 48: Bond ILS Corporate (+7.13 Prozent) |
| Platz 64: Bond ILS (+5.95 Prozent) |
| Platz 72: Bond ILS Government (+5.66 Prozent) |
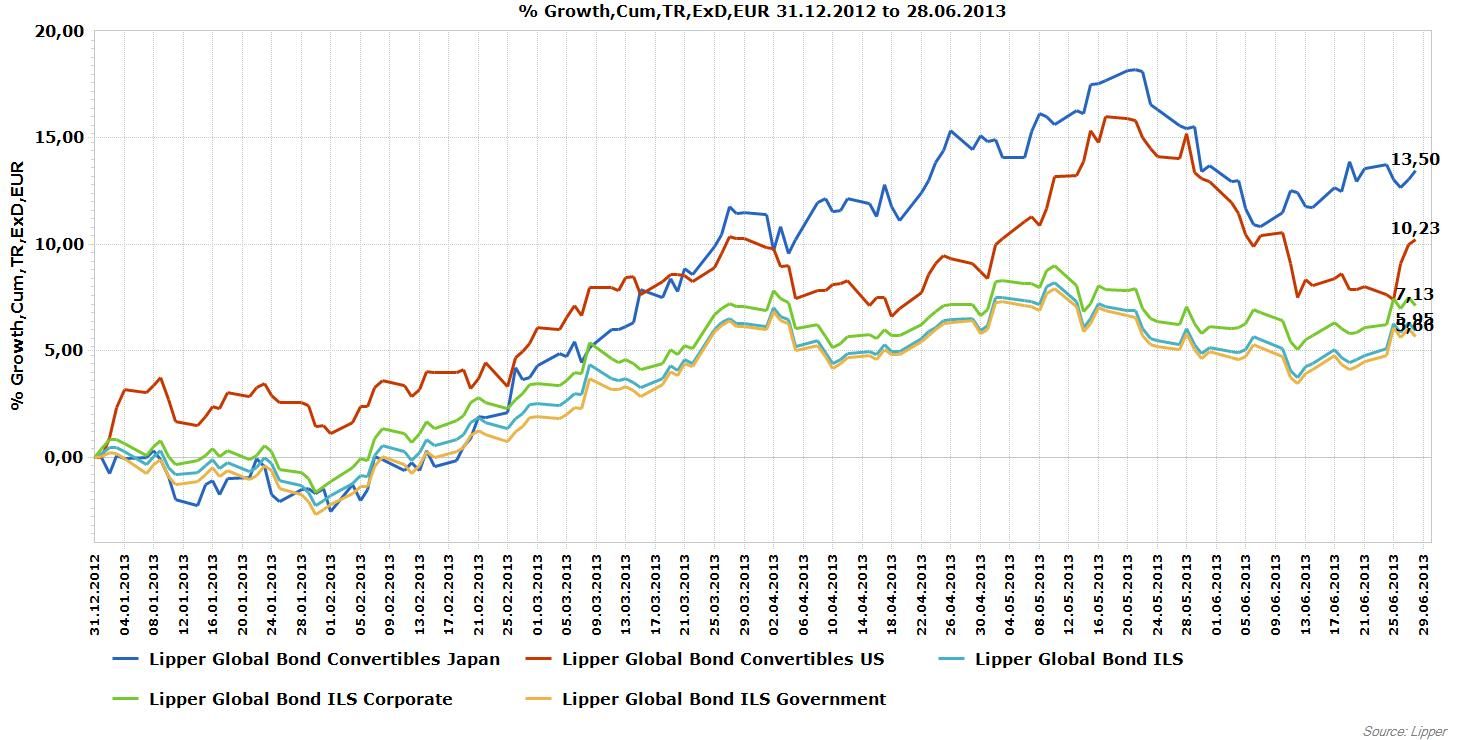
Performance weiterer wichtiger Anleihenfondsanlageklassen
| Platz 215: Bond EUR (+0.02 Prozent) |
| Platz 261: Bond USD (-0.9 Prozent) |
| Platz 267: Bond Europe (-1.11 Prozent) |
| Platz 330: Bond Global (-3.63 Prozent) |
| Platz 398: Bond Emerging Markets Global LC (-6.95 Prozent) |
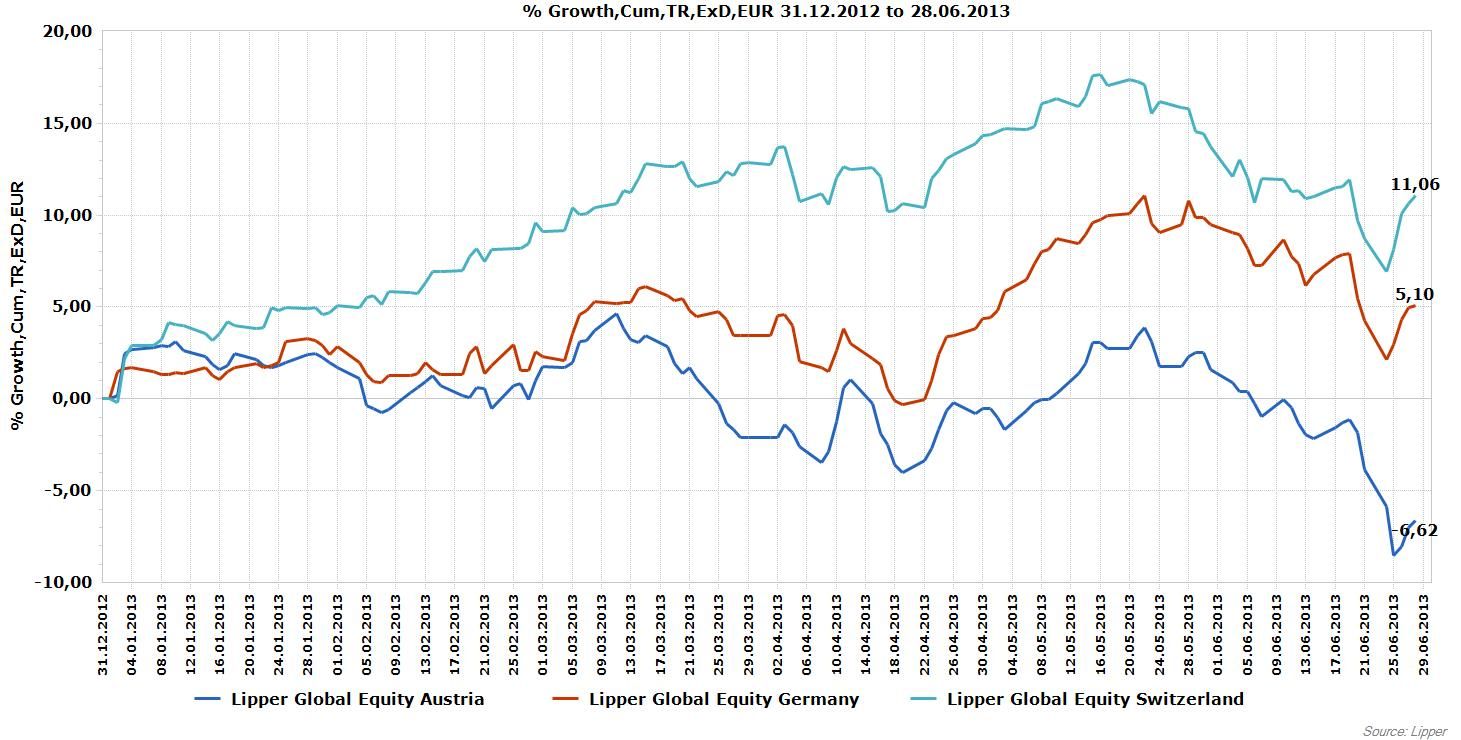
D-A-CH Region: Österreich weiterhin der Underperformer
| Platz 20: Equity Switzerland (+11.06 Prozent) |
| Platz 82: Equity Germany (+5.1 Prozent) |
| Platz 393: Equity Austria (-6.62 Prozent) |
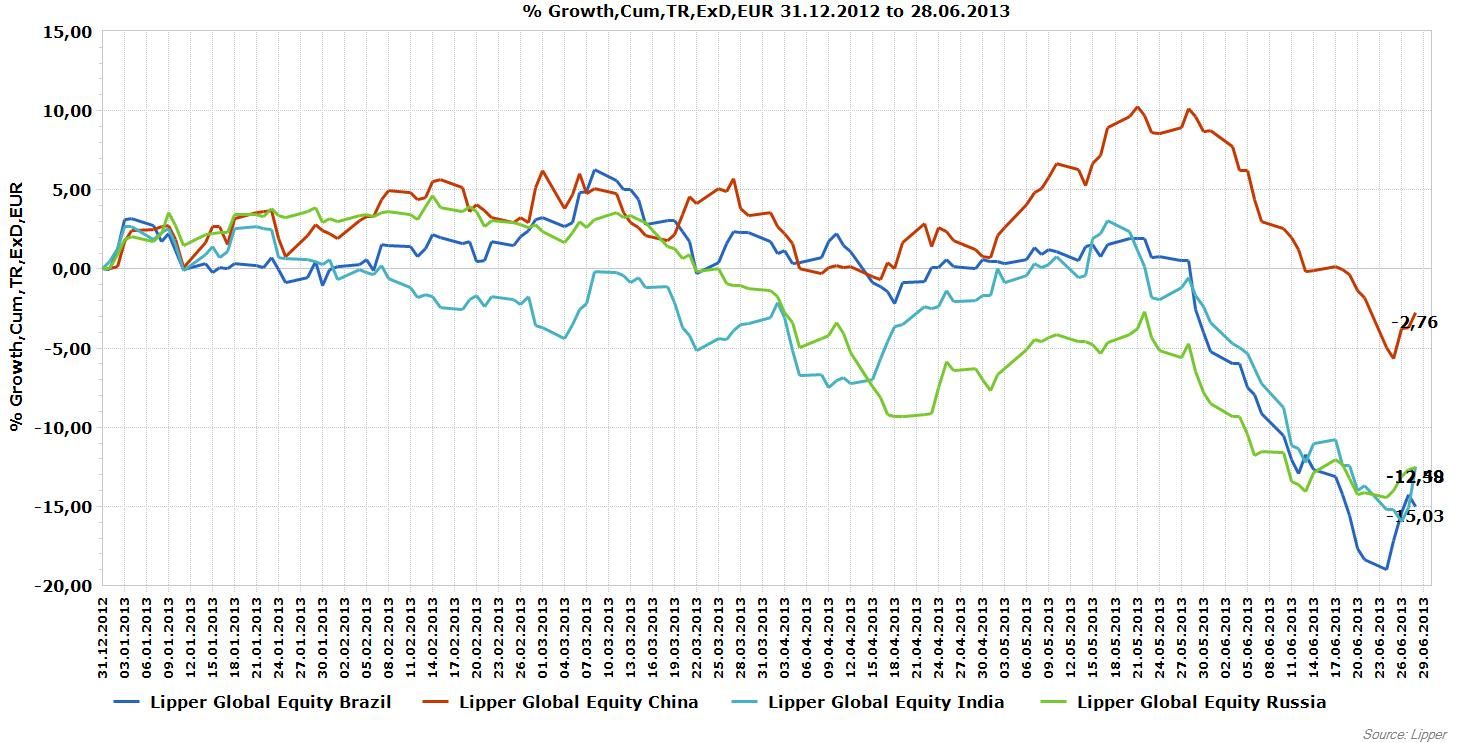
| Platz 313: Equity China (-2.76 Prozent) |
| Platz 438: Equity India (-12.49 Prozent) |
| Platz 439: Equity Russia (-12.58 Prozent) |
| Platz 446: Equity Brazil (-15.03 Prozent) |
Nordic Equity
| Platz 18: Equity Denmark (+11.57 Prozent) |
| Platz 65: Equity Finland (+5.92 Prozent) |
| Platz 94: Equity Sweden (+4.37 Prozent) |
| Platz 138: Equity Netherlands (+2.16 Prozent) |
| Platz 283: Equity Norway (-1.66 Prozent) |
Lateinamerika
| Platz 333: Equity Argentina (-3.65 Prozent) |
| Platz 402: Equity Mexico (-7.22 Prozent) |
| Platz 443: Equity Chile (-13.84 Prozent) |
Sektoren
| Platz 7: Equity Sector Pharma&Health (+16.94 Prozent) |
| Platz 28: Equity Sector Tech Media&Tele (+8.79 Prozent) |
| Platz 49: Equity Sector Banks&Financial (+7.05 Prozent) |
| Platz 272: Equity Sector Real Est Global (-1.4 Prozent) |
| Platz 449: Equity Sector Gold&Prec Metals (-44.99 Prozent) |
Unternehmensanleihen
| Platz 219: Bond EUR Corporates (-0.08 Prozent) |
| Platz 291: Bond USD Corporates (-2.08 Prozent) |
| Platz 388: Bond GBP Corporates (-6.31 Prozent) |
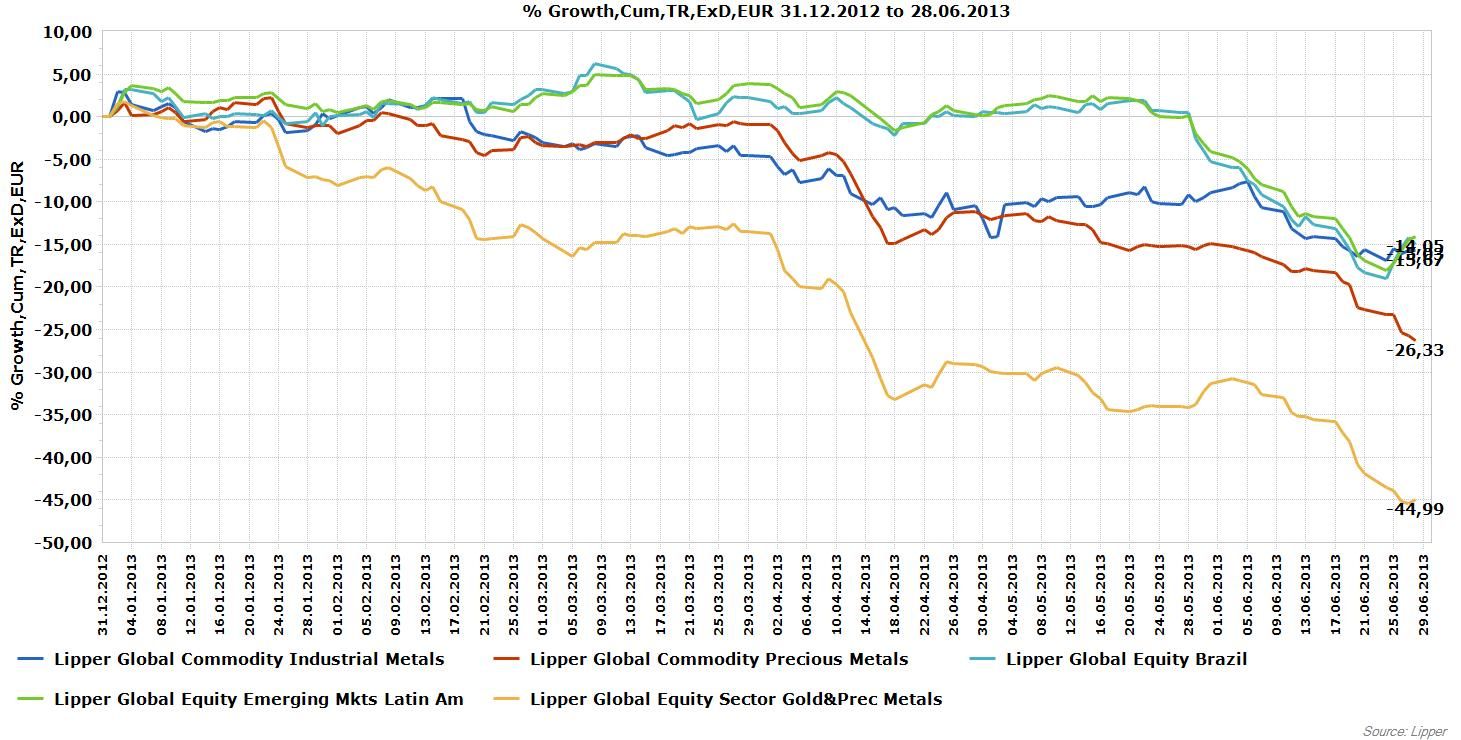
"Es ist nicht alles Gold, was glänzt": Die bislang schwächsten Assetklassen
| Platz 449: Equity Sector Gold&Prec Metals (-44.99 Prozent) |
| Platz 448: Commodity Precious Metals (-26.33 Prozent) |
| Platz 447: Commodity Industrial Metals (-15.67 Prozent) |
| Platz 446: Equity Brazil (-15.03 Prozent) |
| Platz 445: Equity Emerging Mkts Latin Am (-14.05 Prozent) |
Alle Daten per 30.06.2013 / Quelle: Lipper for Investment Management

Weitere beliebte Meldungen:


