Archiv-Beitrag: Dieser Artikel ist älter als ein Jahr.
Asset Allocation Rennen 03/14:
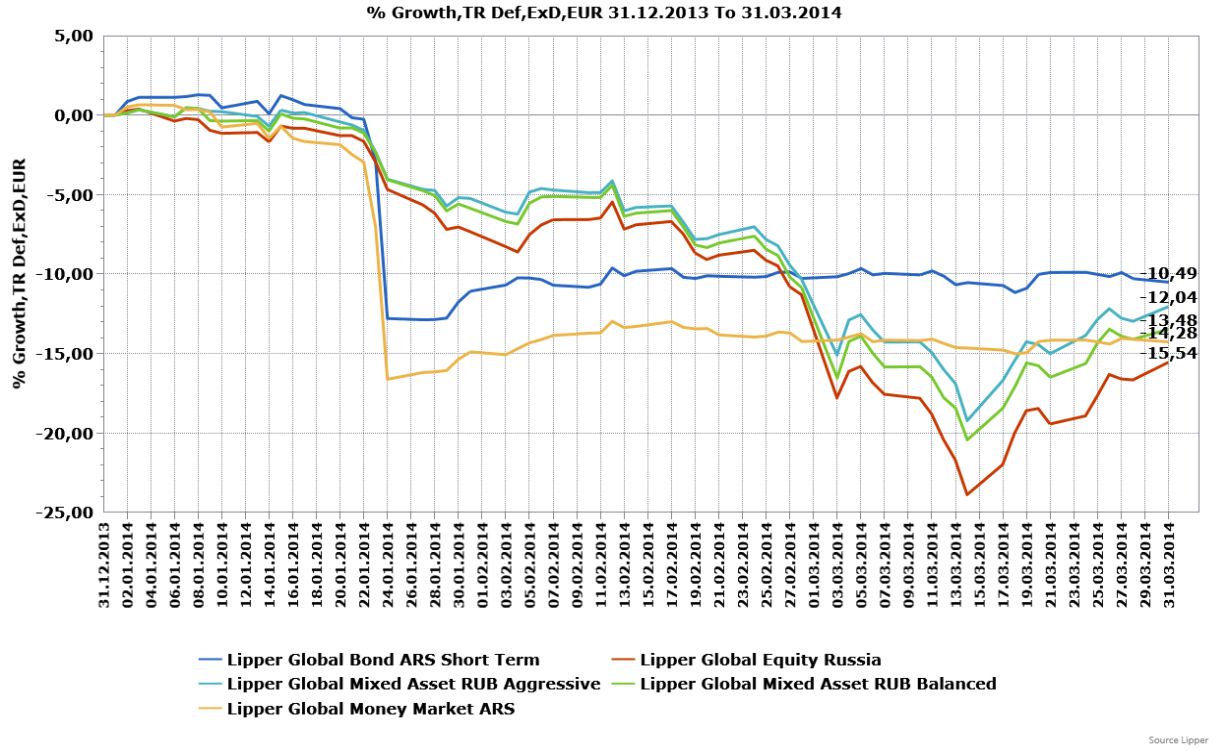
e-fundresearch.com präsentiert die aktuelle YTD-Performance (31.12.2013-31.03.2014) der wichtigsten sowie performance-stärksten Fondskategorien. Bitte beachten Sie, dass sich die Performance-Platzierungen jeweils auf das Universum sämtlicher 449 Lipper Global Assetklassen beziehen.
Die aktuellen Top-5 Assetklassen
| Platz 1: Equity Indonesia (+20,52 Prozent) |
| Platz 2: Equity Portugal (+19,08 Prozent) |
| Platz 3: Equity UAE (+19,06 Prozent) |
| Platz 4: Mixed Asset IDR Aggressive (+17,1 Prozent) |
| Platz 5: Equity Vietnam (+15,51 Prozent) |
Die aktuellen Top-5 Anleihenkategorien
| Platz 18: Bond IDR (+10,16 Prozent) |
| Platz 20: Bond PKR (+9,75 Prozent) |
| Platz 34: Bond BRL (+7,27 Prozent) |
| Platz 39: Bond BRL Short Term (+6,49 Prozent) |
| Platz 41: Bond NZD (+6,33 Prozent) |
YTD-Performance wichtiger Aktienfondskategorien:
| Platz 186: Equity Europe (+1,88 Prozent) |
| Platz 321: Equity US (+0,42 Prozent) |
| Platz 306: Equity Global (+0,58 Prozent) |
| Platz 437: Equity Japan (-7,12 Prozent) |
| Platz 380: Equity Asia Pacific Ex Japan (-0,67 Prozent) |
| Platz 416: Equity Emerging Mkts Global (-2,73 Prozent) |
YTD-Performance wichtiger Anleihenfondskategorien:
| Platz 127: Bond Emerging Markets Global HC (+2,74 Prozent) |
| Platz 328: Bond Emerging Markets Global LC (+0,36 Prozent) |
| Platz 137: Bond Europe (+2,56 Prozent) |
| Platz 151: Bond EUR (+2,29 Prozent) |
| Platz 155: Bond Global (+2,24 Prozent) |
| Platz 209: Bond USD (+1,51 Prozent) |
D-A-CH Vergleich:
| Platz 80: Equity Switzerland (+4,37 Prozent) |
| Platz 324: Equity Germany (+0,4 Prozent) |
| Platz 245: Equity Austria (+1,17 Prozent) |
BRIC-Staaten:
| Platz 449: Equity Russia (-15,54 Prozent) |
| Platz 434: Equity China (-6,01 Prozent) |
| Platz 30: Equity India (+7,41 Prozent) |
| Platz 373: Equity Brazil (-0,6 Prozent) |
Nordic-Equity:
| Platz 22: Equity Denmark (+9,51 Prozent) |
| Platz 119: Equity Norway (+2,87 Prozent) |
| Platz 122: Equity Sweden (+2,8 Prozent) |
| Platz 250: Equity Finland (+1,09 Prozent) |
| Platz 254: Equity Netherlands (+1,08 Prozent) |
LATAM:
| Platz 428: Equity Mexico (-4,91 Prozent) |
| Platz 435: Equity Chile (-6,05 Prozent) |
| Platz 438: Equity Argentina (-7,38 Prozent) |
Sektoren:
| Platz 390: Equity Sector Banks&Financial (-1,02 Prozent) |
| Platz 77: Equity Sector Real Est Global (+4,51 Prozent) |
| Platz 72: Equity Sector Pharma&Health (+4,76 Prozent) |
| Platz 309: Equity Sector Tech Media&Tele (+0,57 Prozent) |
| Platz 14: Equity Sector Gold&Prec Metals (+11,29 Prozent) |
Flop-5 Assetklassen:
| Platz 449: Equity Russia (-15,54 Prozent) |
| Platz 448: Money Market ARS (-14,28 Prozent) |
| Platz 447: Mixed Asset RUB Balanced (-13,48 Prozent) |
| Platz 446: Mixed Asset RUB Aggressive (-12,04 Prozent) |
| Platz 445: Bond ARS Short Term (-10,49 Prozent) |
Weitere beliebte Meldungen:
Performanceergebnisse der Vergangenheit lassen keine Rückschlüsse auf die zukünftige Entwicklung
eines Investmentfonds oder Wertpapiers zu. Wert und Rendite einer Anlage in Fonds oder
Wertpapieren können steigen oder fallen. Anleger können gegebenenfalls nur weniger als das
investierte Kapital ausgezahlt bekommen. Auch Währungsschwankungen können das Investment
beeinflussen. Beachten Sie die Vorschriften für Werbung und Angebot von Anteilen im InvFG 2011
§128 ff. Die Informationen auf www.e-fundresearch.com repräsentieren keine Empfehlungen für den
Kauf, Verkauf oder das Halten von Wertpapieren, Fonds oder sonstigen Vermögensgegenständen. Die
Informationen des Internetauftritts der e-fundresearch.com AG wurden sorgfältig erstellt.
Dennoch kann es zu unbeabsichtigt fehlerhaften Darstellungen kommen. Eine Haftung oder Garantie
für die Aktualität, Richtigkeit und Vollständigkeit der zur Verfügung gestellten Informationen
kann daher nicht übernommen werden. Gleiches gilt auch für alle anderen Websites, auf die
mittels Hyperlink verwiesen wird. Die e-fundresearch.com AG lehnt jegliche Haftung für
unmittelbare, konkrete oder sonstige Schäden ab, die im Zusammenhang mit den angebotenen oder
sonstigen verfügbaren Informationen entstehen.


