

Welche Fondskategorien zeigten im vergangenen Kalendermonat Januar die stärkste Performance-Entwicklung? Wie konnten sich die wichtigsten Mainstream-Kategorien bislang behaupten? Antworten im e-fundresearch.com Asset Allocation Rennen 01/2019:
Durchschnittliche Performance-Entwicklung lag im Januar bei +4,56 Prozent
Die wichtigsten Entwicklungen im Januar kurz zusammengefasst: Im Durchschnitt über alle 274 von e-fundresearch.com in der Morningstar Direct Datenbank untersuchten Fondskategorien konnte im letzten Kalendermonat Januar aus Sicht eines EUR-Investors eine Performance-Entwicklung von 4,56 Prozent gemessen werden. 93,4 Prozent der Kategorien beendeten den Jänner mit einer positiven Wertentwicklung - die Bandbreite der beobachteten Erträge bewegte sich dabei in einem Spektrum von -4,37 Prozent (schwächste Kategorie - India Equity) bis 15,74 Prozent (stärkste Kategorie - Property - Indirect South Africa & Namibia).
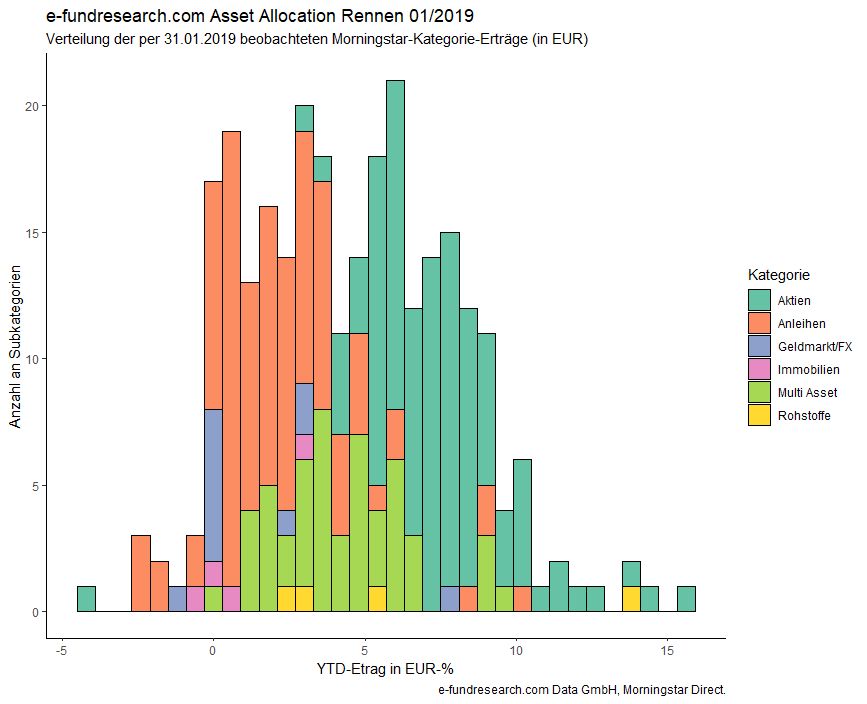


Wie das oben dargestelle Histogramm präsentiert, war die positive Januar-Performance vor allem von einer spürbaren Erholung der Aktienmärkte bzw. Aktienfondskategorien getragen.
Folgende Tabelle präsentiert jene Top- und Flop-10-Fondskategorien, die im Januar die stärkste beziehungsweise schwächste Wertentwicklung verzeichneten:
| Top-10 Fondskategorien: Januar 2019 | |
| Fondskategorie | Januar -P in % |
| Property - Indirect South Africa & Namibia | 15,74% |
| Brazil Equity | 14,27% |
| Turkey Equity | 14,04% |
| Commodities - Energy | 13,79% |
| Latin America Equity | 12,78% |
| Sector Equity Biotechnology | 11,80% |
| Russia Equity | 11,33% |
| UK Mid-Cap Equity | 11,21% |
| Austria Equity | 10,69% |
| Israel Small-Cap Equity | 10,46% |
| Flop-10 Fondskategorien: Januar 2019 | |
| Fondskategorie | Januar -P in % |
| India Equity | -4,37% |
| SEK Inflation-Linked Bond | -2,44% |
| SEK Ultra Short-Term Bond | -2,39% |
| SEK Bond - Short Term | -2,33% |
| SEK Bond | -2,04% |
| SEK Corporate Bond | -1,86% |
| CHF Money Market | -1,07% |
| CHF Bond | -0,64% |
| Property - Direct Global | -0,42% |
| Global Bond - CHF Hedged | -0,32% |
Performance-Update der wichtigsten Fondskategorien
Nachdem die oben dargestellten Top- und Flop-Tabellen auch zahlreiche 'exotischere' Fondskategorien enthalten, die in der Praxis maximal in Form von Satelliten-Allokationen berücksichtigt werden, haben wir Ihnen in den folgenden Tabellen die aktuellsten Performance-Entwicklungen (im Kalendermonat Jänner) der jeweils größten 1) Aktienfonds-, 2) Anleihefonds- sowie 3) Multi Asset Fondskategorien übersichtlich zusammengefasst:
| 1) Ausgewählte Aktienfondskategorien: EUR-Performance Update | |
| Fondskategorie | Januar-P in % |
| Global | |
| Global Equity Income | 5,84% |
| Global Flex-Cap Equity | 7,54% |
| Global Large-Cap Blend Equity | 6,75% |
| Global Large-Cap Growth Equity | 7,31% |
| Global Large-Cap Value Equity | 7,14% |
| Global Small-Cap Equity | 8,51% |
| USA | |
| US Flex-Cap Equity | 8,35% |
| US Large-Cap Blend Equity | 7,14% |
| US Large-Cap Growth Equity | 8,11% |
| US Large-Cap Value Equity | 7,33% |
| US Mid-Cap Equity | 10,05% |
| US Small-Cap Equity | 10,14% |
| Europa / Eurozone | |
| Europe Equity Income | 5,87% |
| Europe ex-UK Large-Cap Equity | 6,42% |
| Europe ex-UK Small/Mid-Cap Equity | 7,93% |
| Europe Flex-Cap Equity | 7,17% |
| Europe Large-Cap Blend Equity | 6,10% |
| Europe Large-Cap Growth Equity | 5,97% |
| Europe Large-Cap Value Equity | 6,56% |
| Europe Mid-Cap Equity | 8,6% |
| Europe Small-Cap Equity | 8,26% |
| Eurozone Large-Cap Equity | 5,87% |
| Eurozone Mid-Cap Equity | 8,26% |
| Emerging Markets / Frontier Markets | |
| Global Emerging Markets Equity | 7,47% |
| Global Emerging Markets Small/Mid-Cap Equity | 5,46% |
| Emerging Europe Equity | 9,29% |
| Emerging Europe ex-Russia Equity | 3,91% |
| Global Frontier Markets Equity | 5,11% |
| India Equity | -4,37% |
| Latin America Equity | 12,78% |
| Russia Equity | 11,33% |
| China Equity | 8,08% |
| China Equity - A Shares | 7,70% |
| Brazil Equity | 14,27% |
| BRIC Equity | 8,94% |
| DACH-Region | |
| Austria Equity | 10,69% |
| Germany Large-Cap Equity | 7,12% |
| Germany Small/Mid-Cap Equity | 8,72% |
| Switzerland Large-Cap Equity | 5,82% |
| Switzerland Small/Mid-Cap Equity | 7,76% |
| Asien / Japan | |
| ASEAN Equity | 5,69% |
| Asia ex Japan Equity | 6,10% |
| Asia ex-Japan Small/Mid-Cap Equity | 3,83% |
| Asia-Pacific ex-Japan Equity | 6,23% |
| Asia-Pacific ex-Japan Equity Income | 6,11% |
| Japan Flex-Cap Equity | 5,26% |
| Japan Large-Cap Equity | 5,21% |
| Japan Small/Mid-Cap Equity | 5,26% |
| 2) Ausgewählte Anleihefondskategorien: EUR-Performance Update | |
| Fondskategorie | Januar-P in % |
| Global | |
| Global Bond | 1,24% |
| Global Bond - CHF Hedged | -0,32% |
| Global Bond - EUR Biased | 0,80% |
| Global Bond - EUR Hedged | 0,81% |
| Global Flexible Bond | 1,39% |
| Global Flexible Bond - CHF Hedged | 0,58% |
| Global Flexible Bond - EUR Hedged | 1,57% |
| EUR / Europe | |
| EUR Bond - Long Term | 2,13% |
| EUR Diversified Bond | 0,64% |
| EUR Diversified Bond - Short Term | 0,11% |
| EUR Flexible Bond | 0,90% |
| EUR Government Bond | 0,67% |
| EUR Government Bond - Short Term | 0,20% |
| Europe Bond | 0,85% |
| USD / USA | |
| USD Diversified Bond | 0,72% |
| USD Diversified Bond - Short Term | 0,10% |
| USD Flexible Bond | 1,57% |
| USD Government Bond | 0,24% |
| Emerging Markets | |
| Global Emerging Markets Bond | 3,17% |
| Global Emerging Markets Bond - EUR Biased | 3,24% |
| Global Emerging Markets Bond - Local Currency | 3,97% |
| Global Emerging Markets Corporate Bond | 2,24% |
| Global Emerging Markets Corporate Bond - EUR Biased | 2,17% |
| Emerging Europe Bond | 1,53% |
| Asia Bond | 1,66% |
| Asia Bond - Local Currency | 1,41% |
| RMB Bond | 2,67% |
| RMB Bond - Onshore | 2,59% |
| Corporates | |
| USD Corporate Bond | 1,57% |
| Global Corporate Bond | 1,75% |
| Global Corporate Bond - CHF Hedged | 0,09% |
| Global Corporate Bond - EUR Hedged | 1,27% |
| EUR Corporate Bond | 0,78% |
| EUR Corporate Bond - Short Term | 0,31% |
| High Yield | |
| Asia High Yield Bond | 2,54% |
| EUR High Yield Bond | 1,75% |
| Global High Yield Bond | 3,04% |
| Global High Yield Bond - CHF Hedged | 1,89% |
| Global High Yield Bond - EUR Hedged | 2,85% |
| USD High Yield Bond | 3,57% |
| 3) Ausgewählte Multi-Asset Kategorien: EUR-Performance Update | |
| Fondskategorie | Januar-P in % |
| EUR | |
| EUR Aggressive Allocation | 4,76% |
| EUR Aggressive Allocation - Global | 5,05% |
| EUR Cautious Allocation | 1,74% |
| EUR Cautious Allocation - Global | 1,89% |
| EUR Flexible Allocation | 3,11% |
| EUR Flexible Allocation - Global | 3,50% |
| EUR Moderate Allocation | 3,25% |
| EUR Moderate Allocation - Global | 3,33% |
| CHF | |
| CHF Cautious Allocation | 1,20% |
| CHF Moderate Allocation | 2,43% |
| USD | |
| USD Aggressive Allocation | 4,72% |
| USD Cautious Allocation | 1,92% |
| USD Flexible Allocation | 3,30% |
| USD Moderate Allocation | 3,53% |
| Emerging Markets | |
| Global Emerging Markets Allocation | 5,02% |
Methodik des e-fundresearch.com Asset Allocation Rennens: Im Rahmen des e-fundresearch.com Asset Allocation Rennens werden im monatlichen Intervall die EUR-Erträge (Year-to-Date bzw. letztes Kalendermonat) sämtlicher Morningstar-Fondskategorien gemessen, die über zumindest 5 aktive und zugeordnete Fondsstrategien verfügen. Datenquelle: e-fundresearch.com Data GmbH, Morningstar Direct.
Weitere beliebte Meldungen:


