Archiv-Beitrag: Dieser Artikel ist älter als ein Jahr.
Die aktuellen Top-5 Assetklassen
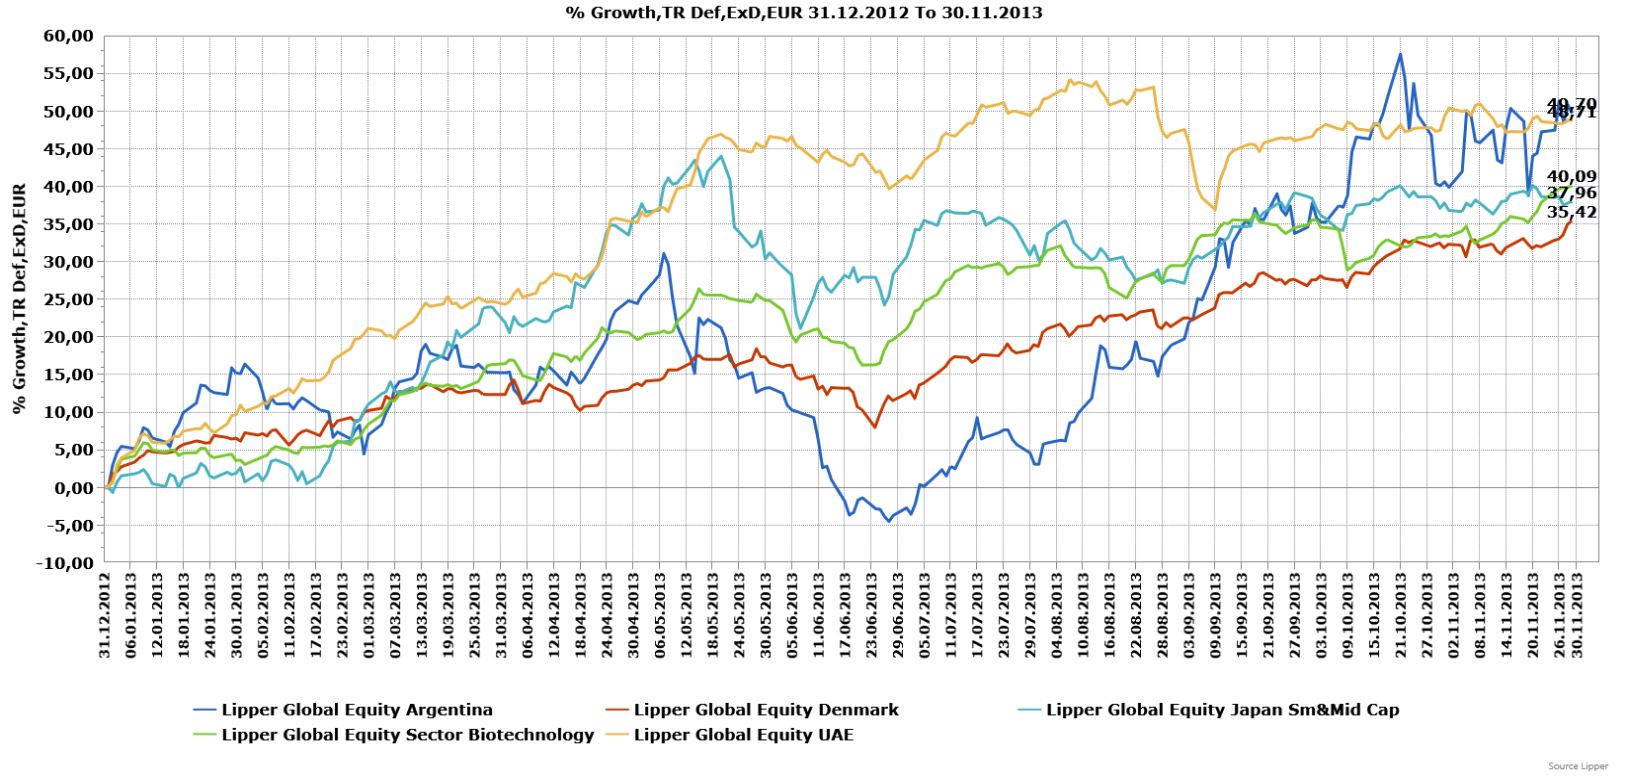
| Platz 1: Equity Argentina (+49.7 Prozent) |
| Platz 2: Equity UAE (+48.71 Prozent) |
| Platz 3: Equity Sector Biotechnology (+40.09 Prozent) |
| Platz 4: Equity Japan Sm&Mid Cap (+37.96 Prozent) |
| Platz 5: Equity Denmark (+35.42 Prozent) |
| Platz 61: Bond Convertibles Japan (+15.23 Prozent) |
| Platz 64: Bond Convertibles US (+14.68 Prozent) |
| Platz 96: Bond ILS Corporate (+9.66 Prozent) |
| Platz 102: Bond Convertibles Europe (+8.31 Prozent) |
| Platz 110: Bond ILS (+7.56 Prozent) |
Der Artikel wird nach der Anzeige fortgesetzt.
14.10.2025 10:00
30 Min.
Jörg Peter Kroll
| Platz 22: Equity US (+24.07 Prozent) |
| Platz 23: Equity Japan (+23.79 Prozent) |
| Platz 53: Equity Europe (+17.32 Prozent) |
| Platz 68: Equity Global (+14.41 Prozent) |
| Platz 236: Equity Asia Pacific Ex Japan (-0.03 Prozent) |
| Platz 319: Equity Emerging Mkts Global (-4.23 Prozent) |
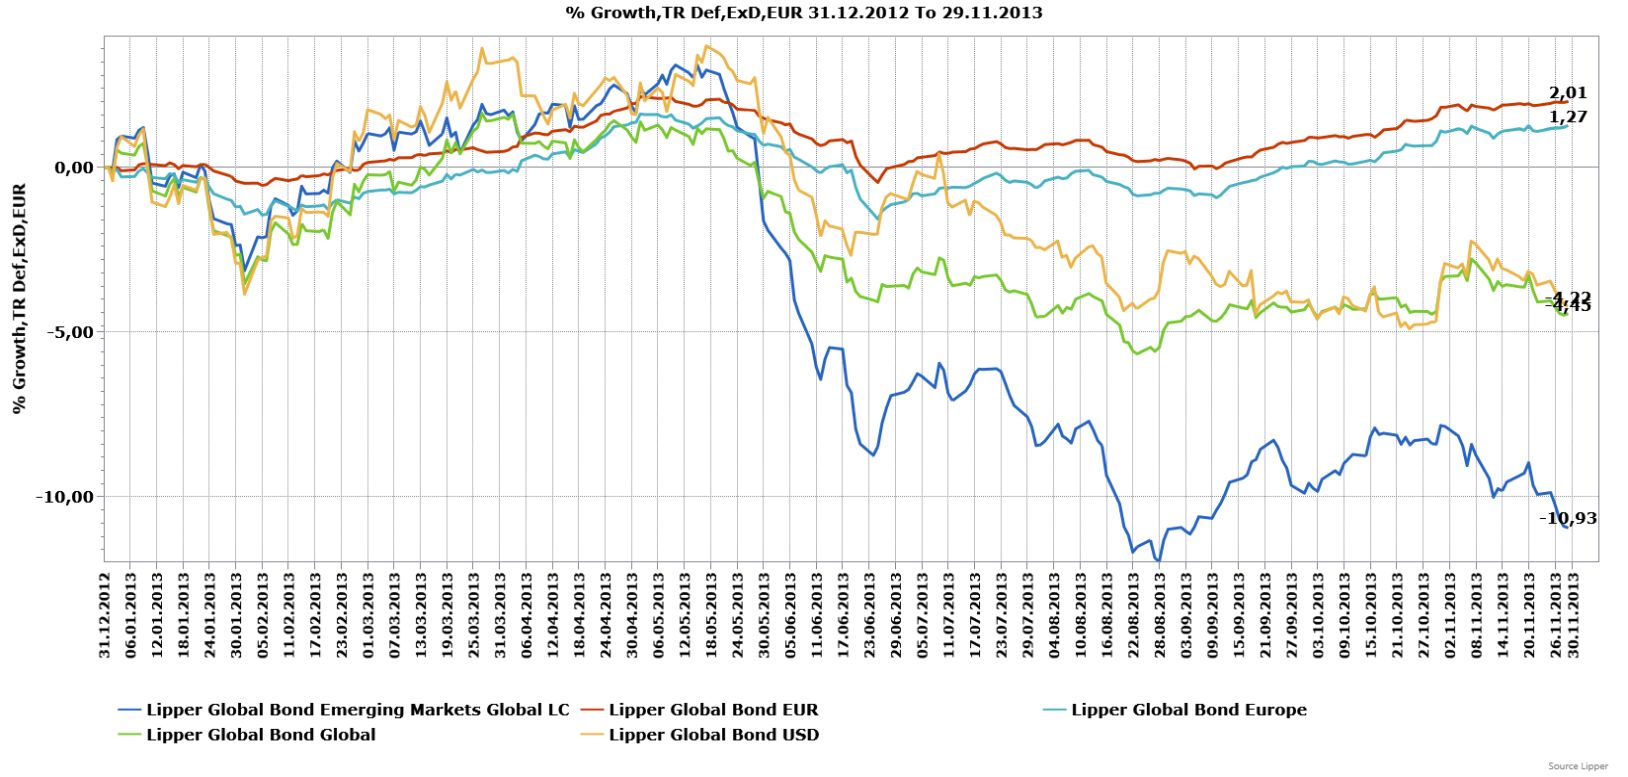
| Platz 191: Bond EUR (+2.01 Prozent) |
| Platz 206: Bond Europe (+1.27 Prozent) |
| Platz 318: Bond USD (-4.22 Prozent) |
| Platz 322: Bond Global (-4.45 Prozent) |
| Platz 399: Bond Emerging Markets Global LC (-10.93 Prozent) |
| Platz 26: Equity Germany (+22.15 Prozent) |
| Platz 28: Equity Switzerland (+21.45 Prozent) |
| Platz 86: Equity Austria (+10.33 Prozent) |
BRICs: China löst sich los
| Platz 111: Equity China (+7.54 Prozent) |
| Platz 370: Equity Russia (-7.63 Prozent) |
| Platz 425: Equity India (-14.1 Prozent) |
| Platz 439: Equity Brazil (-17.82 Prozent) |
Nordische Staaten eine der größten Überraschungen 2013:
| Platz 5: Equity Denmark (+35.42 Prozent) |
| Platz 13: Equity Finland (+28.04 Prozent) |
| Platz 39: Equity Netherlands (+18.91 Prozent) |
| Platz 54: Equity Sweden (+17.11 Prozent) |
| Platz 106: Equity Norway (+8.03 Prozent) |
Sektor-Fonds im Vergleich:
| Platz 7: Equity Sector Pharma&Health (+29.58 Prozent) |
| Platz 27: Equity Sector Tech Media&Tele (+21.51 Prozent) |
| Platz 57: Equity Sector Banks&Financial (+16.37 Prozent) |
| Platz 294: Equity Sector Real Est Global (-2.82 Prozent) |
| Platz 449: Equity Sector Gold&Prec Metals (-46.25 Prozent) |
Corporate Bonds:
| Platz 176: Bond EUR Corporates (+2.68 Prozent) |
| Platz 251: Bond GBP Corporates (-0.63 Prozent) |
| Platz 330: Bond USD Corporates (-4.74 Prozent) |
Flop-5: Gold-Aktienfonds mit verheerender Performance 2013
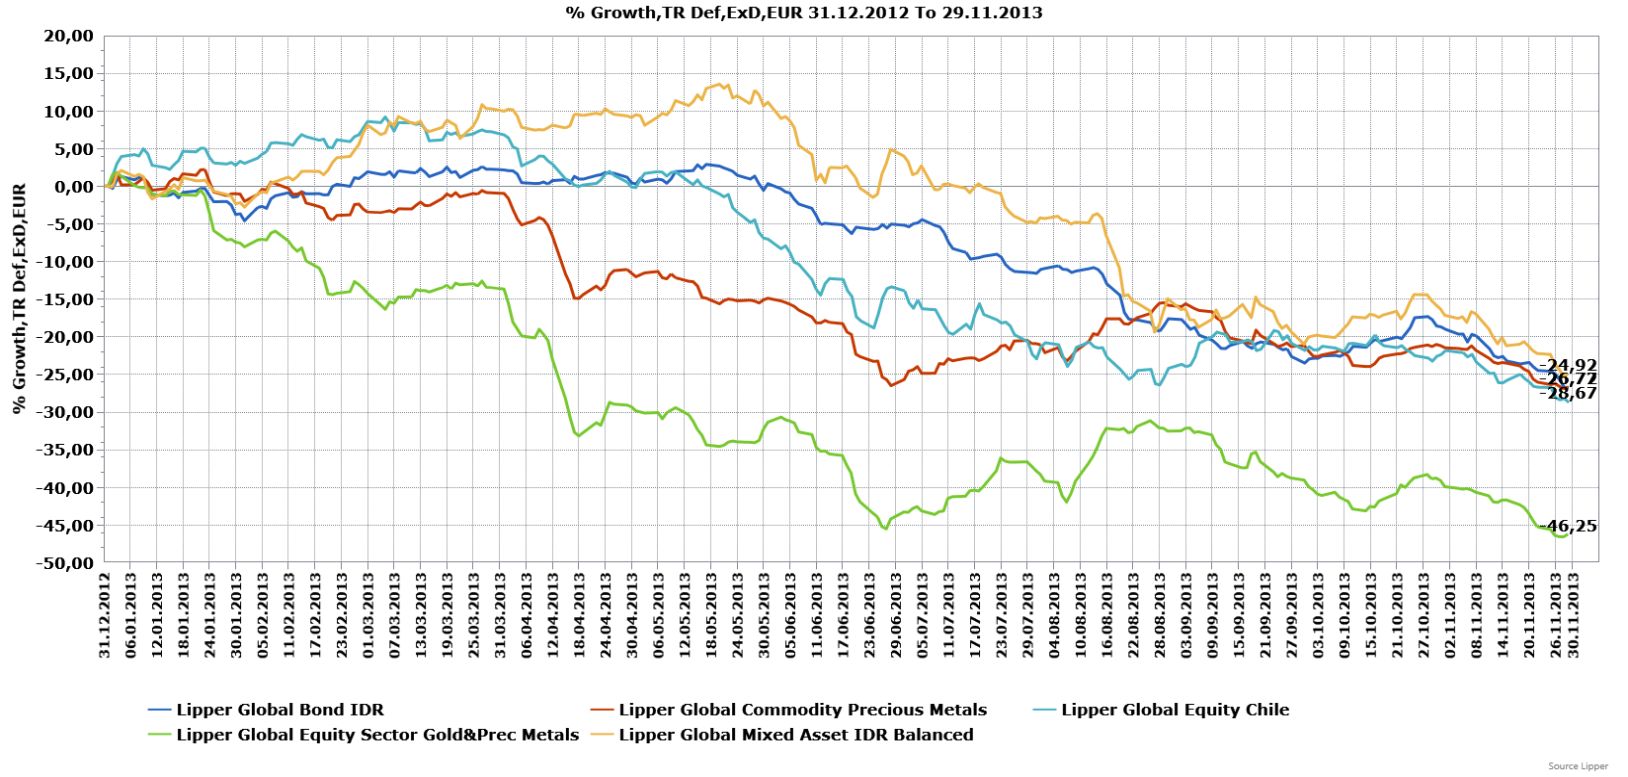
| Platz 449: Equity Sector Gold&Prec Metals (-46.25 Prozent) |
| Platz 448: Equity Chile (-28.67 Prozent) |
| Platz 447: Bond IDR (-26.77 Prozent) |
| Platz 446: Commodity Precious Metals (-26.72 Prozent) |
| Platz 445: Mixed Asset IDR Balanced (-24.92 Prozent) |
Alle Daten per 30.11.2013 / Quelle: Lipper for Investment Management

Weitere beliebte Meldungen:
Performanceergebnisse der Vergangenheit lassen keine Rückschlüsse auf die zukünftige Entwicklung
eines Investmentfonds oder Wertpapiers zu. Wert und Rendite einer Anlage in Fonds oder
Wertpapieren können steigen oder fallen. Anleger können gegebenenfalls nur weniger als das
investierte Kapital ausgezahlt bekommen. Auch Währungsschwankungen können das Investment
beeinflussen. Beachten Sie die Vorschriften für Werbung und Angebot von Anteilen im InvFG 2011
§128 ff. Die Informationen auf www.e-fundresearch.com repräsentieren keine Empfehlungen für den
Kauf, Verkauf oder das Halten von Wertpapieren, Fonds oder sonstigen Vermögensgegenständen. Die
Informationen des Internetauftritts der e-fundresearch.com AG wurden sorgfältig erstellt.
Dennoch kann es zu unbeabsichtigt fehlerhaften Darstellungen kommen. Eine Haftung oder Garantie
für die Aktualität, Richtigkeit und Vollständigkeit der zur Verfügung gestellten Informationen
kann daher nicht übernommen werden. Gleiches gilt auch für alle anderen Websites, auf die
mittels Hyperlink verwiesen wird. Die e-fundresearch.com AG lehnt jegliche Haftung für
unmittelbare, konkrete oder sonstige Schäden ab, die im Zusammenhang mit den angebotenen oder
sonstigen verfügbaren Informationen entstehen.


